Tuesday, April 24, 2012

The Art of Speculation Series 7 - How to Anticipate Market Conditions


The gyrations in daily stock market prices are due to the greed and fear of investors. This is also called the tides of speculation. Before we begin the discussion on the topic, it is best you try to look at the above chart to understand what constitute a market cycle.

Keep cool while others lose theirs


Whenever there is euphoria over a particular stock investors will be pouring over the stock in order to have a bit of the action. When fear hits, they will be rushing out in panic like someone yelling ‘fire’ in a packed cinema. So one of the pillar of success in investing in the markets is keeping your head while others are about to lose theirs.   

Understanding where we are in a stock market cycle is one of the most important information that we need to know for successful speculation. Even if you have insider information of a certain stock which have good fundamentals will not do any good to the stock prices, if it is trading in the euphoria phase. Chances of it coming down is much higher as it is already on its last leg of the run.

Know the Stock Level


The problem is most people don’t know where the stock is coming ‘in from’. That means they buy the stock either through tips, broker recommendations, chasing the stock or any other reasons other than ‘what level it is trading at before’.

As you know there are only three ways a stock can move and they are up, down and sideways. So without understanding at what level the market is trending, it makes it very difficult to make money.

Ways to recognize market conditions


The problem is how do we recognize the ‘level’ where the market is now trending? Fortunately, there are several ways that helps us to determine the market condition.

One, is the failure of stocks to respond to good news. During a bull run, the market will react favorably to any piece of news as long as it is good. News like declaring dividend, better than expected results, Merger and Acquisition, signing of a large contract, discovery of a large mineral deposit and etc, will tend to push up the stock prices. Investors should take note whenever such announcements are made and the market does not respond, it means that serious trouble lies ahead. This is because such news are already factored into the market and the market had already run out of steam. What’s next? Expect sharp reversal of the market to follow.

Two,  it is exactly the opposite of the first symptom. During the bull run, whenever there are bad news announced, stocks are still advancing. This happens because stock promoters and market makers are doing their best to support stock prices so that they can distribute as much stocks they can before the impending fall. Individual investors usually had their minds blurred by the market euphoria, failed to recognize such conditions. They are only able to see rosy things and advancing prices and volumes. Failure to anticipate such events will result in big losses when the market turns.

Three, another pattern that need to be identified is the volume build up without the commensurate advancing in stock prices. Such conditions represent what we called ‘distribution’ by informed investors. Informed investors with advanced knowledge of the market conditions will start unloading. However to an uninformed investor, a build up of volume is a good indication that better things are ahead.

In order to recognize the distribution of stocks, we need to study the high, low and volume traded of leading issues. If the leading issues are trading at the same or lower price than yesterday’s closing but with a much higher volume then we can conclude that someone is unloading the stocks. Then we can anticipate a downturn in the leading issues in the next few days.

Four, if the volume of the overall market is trading at record levels then investors need to         
Be careful. Normally under such conditions, it represents the euphoria stage (see chart above) and this is where every mother’s sons and daughters will be talking about stocks. There will be a lot of experts offering advise and stock market will be the leading topic of choice be it during cocktail parties or wet market gatherings. Nevertheless, the print media will be doing its utmost assistance to the investing public by publishing news on the market day in day out. To an informed investor, it’s game over and time to leave the party.

So, when you are able to distinguish between the beginning, intermediate and the end of a market run will greatly help you in your stock market speculating endeavor.


Saturday, April 14, 2012

The Significance of 0.618 and 1.618 in forecasting the Financial Markets


Fibonacci numbers is actually derived from a study on how fast a pair of rabbit breeds. The study is done by one of Europe’s greatest mathematician during the middle ages by the name of  Leonardo Pisano, circa 1175AD. He is one of the first people to introduce Hindu-Arabic number system to Europe.

Origin of Fibonacci numbers


The study on the proliferation of rabbits is based on the assumption that the pair of rabbit never dies and always produces a new pair by end of the month. The question that we seek is how many pair of rabbits will there be in a year? On the first month there will be a new pair, the second month there two pairs and on the third month there will be three pairs and so on.

Hence the Fibonacci Summation is born. It is a series of numbers and to get the following number all you need to do is to add the current and previous number. It can be shown in the following.

1,1,2,3,5,8,13,21,34,55,89,144,233,377,610, ad infinitum.

Convergence to 0.618


However the numbers in this summation is somehow related to each other. What happen if you take the first number and divide with the second and the second with the third and the third with the fourth and so forth. You will find that as you go along the summation series the division will converge to 0.618 which is also known as the ‘Golden Ratio’.


NumberDivisionResult
1
N/A
1
1div1
1
2
1div2
0.5
3
2div3
0.666
5
3div5
0.6
8
5div8
0.625
13
8div13
0.615
21
13div21
0.619
34
21div34
0.617
55
34div55
0.61818
89
55div89
0.61796


More Mind Boggling Discovery


Even if you start with a different number in the series , the ratio will still converge back to 0.618. This was discovered by William F. Eng and known as the Eng Summation.


a) In this case the first number is bigger than the second

6,4,10,14,24,38,62,100,162,262, ad infinitum

when you divide 162/262 you get 0.6183


b) In this case the first two numbers are one positive and one negative

     -12,7,-5,2,-3,-1,-4,-5,-9,-14,-23,-37,-60,-97,-157, ad infinitum

     when you divide -60/-97 you get -0.6185


c) In this case the first number is a positive but the second is a negative.

    28,-12,16,4,20,24,44,68,112,180,292,472,764,1236,  ad infinitum
    
    when you divide 764/1236 you get 0.6181


What the above display is that whatever numbers not only in what order, eventually it will converge back to the golden ratio of 0.618.

This shows the importance of using the ratio to display the interdependence of any number in the series even though there are not in line with the original Fibonacci Series.

Again if you divide the numbers the other way round and that means second divide by first and third divide by second and so on. Again you will find that the series will converge to 1.618.

Daily Life displaying Golden Ratio


This ratio is important because it occurs in many natural things such as seashell, galaxies, sunflower and so on. The distance at any point in seashell spiral to the center of the shell can always be related to the golden ratio. Even most flower petals are related to fibonacci numbers. Lilies and iris have 3 petals, buttercups have 5 petals, delphiniums have 8 petals, marigolds have 13 petals, asters have 21 petals and daisies have 34, 55 and 89 petals.
     
It even exists in our human body. If you measure the height of your belly button and divide it by your total height, the answer approximates 0.618.

So now the question is, how does Fibonacci summation help us in forecasting Financial Markets.

As far as we know if you divide the previous number (which is smaller) with the current number in the series, the ratio tends to converge to 0.618

Similarly, if you divide the next number (which is bigger) with the current number in the series, the ratio tends to converge to 1.618.  


Fibonacci numbers in Stock Markets

The important numbers are 23.6%, 38.2%, 50%, 61.8%, 78.4% and 100% or percentages of retracement or advancement. The figure 23.6% can be found by dividing a number with another number which is located three place to the right of the summation (13/55 = 0.236). The 38.2% can be found by dividing a number with another number which is located two places to the right (34/89 = 0.382) and so on.

To forecast the level of retracement during a decline or advance we need to find the lowest and highest point in a chart and draw a trend line connecting them. Hence the fibonacci retracement can be obtained from there. The following chart shows a fibonacci retracement in percentages after a bull run.


Similarly the following chart shows a fibonacci rebound in percentages after a bear run.


Fibonacci Time Zones

However we can extend the Fibonacci Summation series to study time zones that can provide potential movement in prices. The summation can be applied as 1 bar, 2 bars, 3 bars, 5 bars, 8 bars, 13 bars, 21 bars, 34 bars and so on. A Fibonacci time series chart can be shown below.


As you can see from the above chart, different time zones are displayed that may indicate a change in the market price. However as a word of precaution, I never depend exclusively on Fibonacci in my market trading. I use it in conjunction with other indicators to get a second opinion because sometimes these indicators don’t work all the time in different market conditions like sideways or unactive markets.

I use Fibonacci to identify retracement levels in advance and decline markets and also to find price clusters or base building activities which are very good setups for profitable trading.

Moreover, with the discovery of the Eng Summation, it denotes another important finding and that is we don’t need numbers to be in exact to the numbers in the Fibonacci Series in order to have a precise prediction. Any numbers will do !!   

Another significant implication is that when any two unrelated numbers are related due to the golden ratio will mean that there will be many opportunities to trade in between 2 and 3 or 2 and five or 3 and eight days time period. This is because there will be many set of Fibonacci summation numbers that will converge to 0.618. That means we can look at a different context of Time Zones. Instead of trading using the monthly or weekly charts, we can downsize it to days, hours and minutes and even up to the seconds and nano seconds charts as used by institutional investors in their High Frequency Trading Algorithms.


That means there also exist Fibonacci retracement charts for advancing and declining markets in milliseconds charts. This will open up a whole new possibility to trade and also means that you will always stays ahead of the crowd. That is why High Frequency Traders will always ahead of us because they trade with softwares that can mechanize their trading methods and algorithms to buy and sell at predefined support and resistance levels.

This explains why HFT traders almost always wins in the market because of the speed of both the hardware and software that they use.Trading software from Nanex Corporation are able to process 1.7 million instructions a second even though the hardware runs on a Pentium 4 processor.


Monday, April 9, 2012

The Art of Speculation Series 6 - Never Panic Buy or Sell


As an investor we need to keep a clear head at all times and not influenced by the daily gyrations of the financial markets. This is due to the shifting from fear to greed and vice versa by the crowd. It is not easy to avoid being caught up in a stampede in the different end of the bull and bear markets. Nobody wants to be left behind during a bull or a bear market rush where the herd is moving. So it is very important to keep your head when others are about to lose theirs.

Never follow the Crowd

This is important because we tend to follow the crowd wherever they move because it is an inbuilt instinct that had been cultivated among us. When we are small our parents always teach us to follow rules and regulations. Don’t walk alone at night, go fishing alone, go swimming alone and so on. Always go with a group so everybody can keep an eye on everybody. So in a way group behavior had been ingrained into our mind and hence our decision making. Instead of having to make decisions individually we tend to follow the herd because it is the safest.

However in the investment world you must trust no one, in your decision making process. Following the crowd is normally a wrong decision. More wrong stocks are sold during panic selling in crisis and bought during panic buying in bull markets than any other times. There are too many tales to be told where folks are making hugh losses due to their bad decision making.

Panic Selling

An example is during the assassination of President Kennedy, the market lost 25% in one week and there is a deluge of panic selling. Everyone wants to get out, primarily because of uncertainty surrounding the stock market, fear, confusion and lack of confidence are the only thoughts in the minds of investors. Losing your mind during such period will certainly means losing your money. Within three years after the assassination of JFK, the S&P rose more than 21%.

Similarly after the 9/11 terrorist attack on the twin towers, the NYSE was closed from September 11 to September 17. On reopening the Dow Jones (DJIA) lost more than 7% or 684 points, resulting in more than $1.4 trillion being wipe out in that week. The airlines and tourism industries were the hardest hit because of fear of another attack. However, the stock market recovered fairly quickly and reached an all time high in 2006.

Panic selling does not only apply to the stock market as a whole but also on individual companies. There are many times companies faced with unforeseen circumstances which might lead to lower or cut dividends completely, earnings lower than expected, strike by workers and etc. A lot of people upon getting such news will start liquidating their shares without even border to check for the reasons. Most of the time you will find that a few days after the announcement the stock price will rebound back to or higher than the original price. The reason being insiders, shrewd investors and other people in the know had already sold their shares at the higher price before the announcements. When the news is announced they have the pleasure of relieving those investors who panicked by buying their shares at a lower price.  

Panic Buying


On the other side of the coin there is always the panic buying by investors. Panic buying occurs when there is good news announced like a contract is sealed, a merger and acquisition exercise, a strike had been settled, a discovery of large mineral deposit and etc. This is the time where investors felt that they don’t want to be left behind in the anticipated price hike in the shares. People just rush in and start bidding the share price to ridiculously high price. End result will surely be profit taking and will result in a much lower price in the next few days.

The bigger danger of panic buying is during the end of a bull run. Normally a bull run ends with a parabolic run up in the share prices. During such times volume are normally very heavy because every investors wants to have a bit of the action. Parabolic runs normally end in tears. This is the time where stock promoters are out in force and newspapers headlines are always about the market that is making new highs week after week. This is where most of the panic buying occurs because no one wants to be left out. This is the sign that serious troubles are ahead because by the time the bubble burst these investors are the last to get out.

Maintain a Cool Head

However as an astute investor, we need to look out for signs of panic buying and don’t join in the rush. Instead we should maintain a cool head and will always provide the pleasure by relieving those investors of their shares when panic sales ensue later.

However as for us getting into such frenzy buying and selling a few times in our career in investing, is a prerequisite for our learning process before we settle down in the business of making serious money.


The Tao Of Trading

Making mistakes is part of our self development in our transformation from being an amateur trader to a master trader. Our ultimate aim in trading the markets is to achieve what we call the ‘Tao Of Trading’. When you reach this level your mind is in a state of calm and serenity. Your approach to the market is different even during the market crash because you already anticipated the event before it happened.

Anyway to reach the ‘The Tao Of Trading’ mindset is not easy. You have to go through different stages of internal development. It took me more than 10 years of losing in the market in order to understand almost all possible ways to lose. Yes folks, the idea is to learn all possible ways to lose. I am still losing in some of my trades today but the most important thing is I make sure that my portfolio come out positive at the end of the period. 

Wednesday, April 4, 2012

Why Stock Market Indexes are making new Highs but not our Portfolio?


If we look at the charts of most Stock Markets in the world, the trend seems to be bullish biased. It is always bullish and will remain so in the future.
 Just look at the following 50 years chart. The Dow had been going up since the 1960s and is still going up because it is always long term bullish biased.


The question is how can the market be so bullish when economic data suggest otherwise?

For example just take a look at America’s problems which include $15 trillion in funded and $135 trillion in unfunded debts, budget deficits of more than $1.3 trillion in 2011 fiscal year, more than 8.5% unemployment rate, 46 million Americans on food stamp,  Debt/GDP had already surpass the 100% mark, 23 million workers are either unemployed or underemployed and the lists can go on and on ad infinitum.

How can the Dow Jones be trading at about 13,200 (03/04/2012 closing) which is only less than 1000 points from the all time high of 14,164 points? And yet most of our portfolios are no where near all time high, in fact most of them are now below last year’s level.

In my earlier article on ‘The Danger of having a Weak Economy and a Strong Stock Market’, I have discuss the issue on market overvaluation and why the need for it. Now I am going to show you how they do it.

I am sure a lot of us are frustrated at why our stocks are not making new highs but in fact a lot of them went below the price that we bought?

Take for example yesterday the Indonesian market, their Composite Index IHSG managed to close at an all time high of 4215 after besting the 4196 level, which is set on 01/08/2011.  The market performance was 124 Up, 120 Unchanged and 202 Down. Since the Composite made an all time high, why are there more down than up counters? Why most stocks did not test their new high? In fact they perform worse than last year. The answer can be found in the following.

  1. Firstly, new stocks are added every year through IPO. At the meantime old stocks that are not performing or went into bankruptcy are delisted from the exchange. There are more new stocks added to the list than being taken out and hence the list of stocks grows every year. The Darwinian Law on survival of the fittest also applies to the stock market. Hence every year bad and poorly performed stocks are taken out of the list and new and healthy ones are added to the list.
If you look back at the records of Dow Jones for the last 100 years, less than 3% of the stocks managed to maintain their original name. For the past 50 years only less than 10% managed to do that. What does this tells us? A lot of the companies did not survive intact throughout the years, many of them either delisted, gone during a Merger, Acquisition or being Takeover exercise. And again along the way many new stocks are added while old ones are pushed out from the list.

This is one of the main reason why the stock market is always going up.


  1. Secondly, the Composite Index is made up of only a handful of Stocks. Like the Dow is made up of 30 stocks, Malaysia's KLCI has 100 and so on. Normally these stocks have large market capitalization and hence also their weightage on the Index. Again it is the same old story, ‘not performing or tired’ stocks are taken out of the group and new ones are added into it. So this can be regarded as cheating and they can do continue doing this as long as the index keep going up.

This is also similar to Hedge Funds when they apply survivorship bias in their reporting. Since they are not under the jurisdiction of the Securities Exchange they are not required to report to them. In other words, they are free to cook their books. Under perform quarterly figures are discarded from their annual reporting and hence their reporting is always better than their actual performance.

So why do they want the market to go up? In my earlier article I mentioned that an overvalued market benefit everyone from the stock brokers to the politicians. Only us suckers got squeezed in the end because when the music stops, we are the ones will be the last to leave the party.


  1. Thirdly, we only have ourselves to be blamed. Due to the propaganda by the market promoters and propagandist from the corporate mainstream media we are more or less afflicted with a disease called ‘Normalcy Bias’.

Normalcy Bias refers to a situation where the mental state of the people failed to estimate the possibility and effects of a disaster that is looming. When facing a stock market crash instead of taking evasive action to cut loss we tend to focus on the unexpected event and enter into a state of paralysis. It is normal for investors to be overwhelmed by losses and hence failed to do the right thing and that is to get out of the market. This is because we are constantly fed with ‘good and soothing’ stories by the mainstream media and condition our mind to accept that things are always in good hands and order. Consider the following quote,

"The man who never looks into a newspaper is better informed than he who reads them; inasmuch as he who knows nothing is nearer to the truth than he whose mind is filled with falsehoods and errors." – Thomas Jefferson


So what lessons do we learn from here? 


One. How can we counter this kind of market manipulation? One way is to imitate what they do. Remember how they frequently tossed out bad stocks and replaced them with good ones? The reason being that the Composite Index will always make up of good and healthy stocks and hence will always go up.

So in order to beat the market we need to do the similar thing and that is to ‘chuck the bad and keep the good ’ stocks in our portfolio. Remember to rebalance our portfolio every 3 months and I can tell you your portfolio will perform much better than what you expected.


Two. Another lesson is that the old Wall Street adage 'Stock are for Long Term' does not hold anymore. With the rate stocks are disappearing from the market (less than 10% survived in 50 years),buying now and giving it to your grandchildren is not a good option anymore. Stock promoters in Wall Street or wherever they are will always tell you that the market is always going up. What they didn't tell you is they always change their rules and issues so that people like us will always be suck into the bottomless pit.


Two weeks before Enron collapse analyst still recommend a buy on the stock. One month before MF Global's collapse, analyst still recommending a 'Hold' on the stock. So how can we protect ourselves from the market? The only solution is market education and form your own judgment. Never trust anybody on investment decisions because 'Herd Instincts and Group Behavior' never work in markets.


Later, I will be addressing the issue on ‘Why using Fundamental and Technical Analysis produce mediocre performance in The New Stock Market?’

Monday, April 2, 2012

Should Fuel Subsidies be Removed?

Subsidy can be defined as a financial assistance to certain product or category of industry so that the price will be low, and hopefully continue to provide jobs and spin off other economic activity. Subsidies have been around for ages and it comes in many forms such as cash, labor, farm, export, consumption, education, housing and etc.

Fuel subsidy refers to the effort by the government to pay for the difference between the price of fuel in the pump and the actual cost of the product. So by paying the difference the government enables fuel to be sold at a lower price so that it will help ease the burden its people especially the lower income group.

Before a government began implementing a new policy on either reducing or increasing the fuel subsidy, it had to gauge the public response towards the policy. Whether it is a gradual reduction or a sudden removal of the subsidy will have an economic impact on its people and the economy. A case in point will be the sudden removal of subsidy of fuel in Nigeria this year.

The Government of Goodluck Jonathan had been keeping the price of fuel low at $0.45 a litre. However, on 1st January 2012, President Jonathan abandoned the subsidy for fuel and resulted in a price increase to $0.94 a litre.  The end result is the inflation of more than 100% in food and transportation. Tens of thousands of people are taken to the street to stage demonstrations, which eventually pressured the government to reduce the price of fuel to about $0.69 a litre.

Another example will be the recent Indonesian Government’s attempt to reduce fuel subsidies by another 30% on 1st April 2012, had been met with a roadblock. Due to intense public demonstration, the government had to give in its demand and delayed for another six months.

So from the above scenarios we can assume that the problem does not lie on the Government policy to reduce fuel subsidy but the amount of subsidy that is being removed. In the case of Nigeria, the reduction of fuel price from $0.94 to $0.69 managed to restore law and order in the country.

Such fragile situations are now putting governments in between a hard place and a rock. On one side, no government in its right mind will forever subsidized its citizens for their comfort without being risk of being send to the cleaners (bankruptcy). So there now exist an Opportunity Cost of leaving things unchanged or reduce the subsidy to unleash funds for the development of the country such as infrastructure, health, clean water and etc.  

Understanding Price Elasticity of Demand

Before we go on to address this issue I think we should educate ourselves on some simple economics regarding price elasticity of demand to fuel subsidy.

A product is said to be price elastic when a change in the price will have a big effect on its demand. Products that fell into this category include big-ticket items such as cars, air travel, luxury items, high-end real estates and etc. Such products are very sensitive to price changes. An increase in fuel price will dampen people’s demand for larger cars and also air travel due to the price increase in air tickets.  

Likewise a product is said to be price inelastic when a change in the price will have minimal effect on its demand. Products that make up this category include alcohol, cigarettes, lottery tickets and etc. These products are not sensitive to any price changes because even with a 20% hike in the price of cigarettes will not prevent a smoker from smoking less.

The following graph help explains the concept of price elasticity’s to demand.  

As you can see from the above the steeper the demand curve the lower will be the price elasticity. When price increase from P2 to P1, the reduction of quantity demand is only equivalent to B-A. This is what they call low price elasticity because a small change in price only cause a small change in the quantity demand.

When a product is of a higher price elasticity an increase in the price from P2 to P1 will result in a larger reduction in the quantity demand which can be measured as D-C. This is also referred to as high price elasticity because a small change in price cause a big change in the quantity demand.

Formulating Public Policies


So how can the understanding in the price elasticity of fuel subsidy can aid Governments in implementing their energy policies?

First, by knowing the elasticity of demand, the government can gauge public response towards a policy change that involved a reduction in the fuel subsidy. How can we calculate the elasticity of demand in response to a subsidy reduction.

The elasticity of demand can be calculated with the following formula.

E = (% change in Demand) / (% change in Price)

We present below 3 different scenarios to illustrate how a change in price affects demand


a)     If a 10 % change in price of a product results in a 30% increase in the demand, then we can conclude that the demand is elastic. This is because the percentage change in demand is bigger than the percentage change in price. Hence by using the formula we will obtain,

E = 30% / 10% = 3

b) If a 10 % change in price of a product results in a 5% increase in the demand, then we can conclude that the demand is inelastic. This is because the percentage change in demand is lesser than the percentage change in price. Hence by using the formula we will obtain,

E = 5% / 10% = 0.5

c)     If a 10 % change in price of a product results in a 10% increase in the demand, then we can conclude that the demand is in unit elastic. This is because the percentage change in demand leads to a same percentage change in price. Hence by using the formula we will obtain,
E = 10% / 10% = 1


Consequently, there will be three outcomes from the above equation.  The E can be equal, less than or greater than 1. Economist refers a reading of less than 1 to inelastic, greater than 1 as elastic and equal to 1 as unit elastic where a 10% change in price results in a 10% change in the demand.

According to a study by Robert Archibald and Robert Gillingham of the Review of Economics and Statistics, their analysis on Consumer Demand for Gasoline using Household survey produce the following chart, where it shows how a 10% increase in its price will affect the quantity demanded.


GoodsShort Run (%)Long Run  (%)
Air Travel
1
24
Theatre Opera
2
3
Gasoline
2
5
Medical Care
3
9
Jewelry
4
7
Physician Services
6
6
Alcohol
9
36
Movies
9
37
Automobiles
1
15
China and Glassware
15
26


How do you interpret the data?

It can be interpreted, as in the case of Gasoline, a 10% increase in gasoline price will produce a 2% and 5% reduction in quantity demand for both short and long run respectively. In short we can conclude that Gasoline is inelastic since a 10% increase in price only resulted in less than a 10% reduction in the quantity demand in both short and long run.

The above data shows that on all products surveyed, the long term price elasticity is greater than short term. This is because like the case of gasoline price increase, people will find other alternatives like using public transport, car pooling, use less automobile and more scooters to counter the price increase of Gasoline.

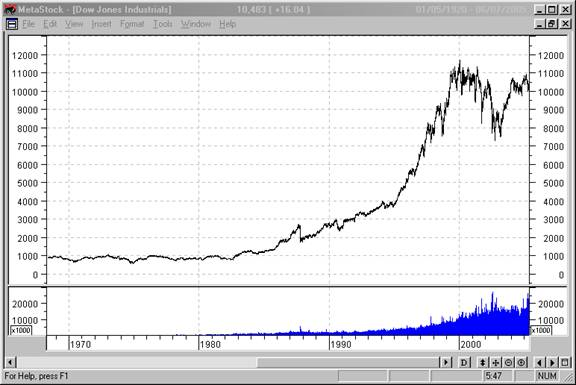
Further evidence of how inelastic oil demand to a price increase can be seen from the following chart.


Even during the peak of about $146 in 2008,demand for oil is still steady at about 87 MBPD. However over the longer term to 2009, the demand slows in response to the price hike. This drop in demand (people are consuming less gasoline due to other alternatives available) causes the price of crude oil to drop to below $40 in 2009.


Effect on Public Policies

Understanding Price Elasticity prove useful to policy makers because when they know that gasoline is inelastic then people will be more adaptive and will tend to find alternatives in the long run. Instead of removing subsidies in big numbers like 30%, 50% or 100% as in Nigeria’s case, they can remove it in stages.

Like in Indonesia’s case, instead of a sudden removal of 30% in subsidy, the government can lessen the pain by prolonging it to18 months with three equal reduction of 10%. By doing this it will give more time for the people to adjust their lifestyle and less protest can be expected. As in Nigeria’s case it demonstrates that people are more tolerable to a 50% reduction ($0.45/$0.69 x 100) than a 100% removal in subsidy

Law of Unintended Consequences

When policy makers draft a policy, their intention is to solve a given problem but unaware that there are other secondary consequences or side effects. It can be interpreted as One Policy but many consequences and this is known as the Law of Unintended Consequences. An example will be the implementation of rent control.

When the government calls for a rent control in certain areas, the effect will be of help to the low-income earners. However, it is not good news for property owners and since the rent is subjected to control the end result will be neglected or run down properties, low vacancy rates, discrimination against the tenants, under maintain properties and so on. Eventually the whole neighborhood will be affected areas.

Likewise when policy makers plan for a reduction in fuel subsidy, all they have in mind is the dollar amount in savings that can be channel to other sectors of the economy. Unintended Consequences like inflationary effect on goods and services, inability of the public transport system to cope with the ‘extra’ passengers, increase in smuggling activities, lost of confidence in the government, flip flop policies, demonstrations and so on are not taken into consideration.


Problems with Fuel Subsidy

After addressing the issues on policy making and its problems we can now direct our attention on the problems arising from fuel subsidy. Any government cannot be forever subsidizing its economy on any schemes be it farm, fuel, electricity, minimum wages and so on. Because sooner or later the Law of Diminishing Returns will prevail because it will reach a point where any further subsidies will only create wastage and inefficient allocation of resources.

The following are the problems that may arise from the effect of fuel subsidy.

  1. High Opportunity Cost. A higher subsidy on fuel means less budgetary spending on other development projects such as infrastructure, health, education, poverty eradication, supply of clean water and other high impact projects. In other words it is denying the funds that should otherwise be used in implementing projects to help improve the well being of the people.


  1. Enriching the rich cronies
      
Fuel subsidies have always been a policy to help a country’s under privileged to ease their burden. However the problem with fuel subsidies is that it had benefited the rich more than the poor. When demand is inelastic to price changes, middleman always seems to have an upper hand in the distribution of the supplies.

There are many cases where subsidized fuel are sold at 3-5 times the original price and instead of helping the lower income, it further burdened them. In India, much effort have been carried out to deliver subsidize kerosene and electricity to targeted lower income consumers. However middleman seems to have their way around by bribing local officials. The result is more than 40% of the subsidize fuel and electricity went to the black market and industrial uses. Hence, it defeats the purpose of providing cheap fuel to needy families while at the same time enriching some of the political cronies.

In the case of Indonesia, home to the world’s largest archipelago with more than 17000 remote islands, enforcement will be out of the question. Fuel that are sold in remote outpost like Maluku Islands, West Papua, NTT, Sulawesi and so on, go as high as 5 times the subsidized price.

Similarly in Malaysia where it borders Thailand and Singapore in the West and Indonesia in the East, fuel smuggling seems to be a booming business. This is due to the higher price differential between Malaysia and its neighbor.

Cars and lorries from Singapore and Thailand are pouring in to fill up their tanks and as a result the government is losing a lot of money subsidizing the wrong group of people. Moreover, certain groups of people like the transport companies, fisherman, company lorries and etc, are allocated a fixed sum of subsidized fuel each month. Instead of using the fuel to help lower their cost of doing business, they resell the fuel to industrial customers.


  1. Increasing world oil price means more State funds will be diverted to fuel subsidies since all countries that provide fuel subsidies are net oil importers. During periods of escalating prices, governments will find it more difficult to finance its subsidies. Years of subsidizing had created a ‘comfort zone’ in many people.


The above chart shows the Oil Consumption versus Production. From 2012 onwards the gap between the consumption and production continue to widen which signifies further price hike in oil in the future. So it certainly look foolish for any government to continue subsidizing fuel into the future because the higher the price the bigger will be the subsidy.

To them it is almost like a natural birth right for the government to provide them with cheap fuel. Cut in subsidies will always met with resistance and demonstrations from certain special interest groups especially the large industrial users and middlemen.


  1. A country’s economic development is directly linked to its energy supply. Without energy its economic activity will grind to a halt. It is always a preferable government policy to encourage the development of alternative and renewable energy like solar, wind and wave. Further on that the government will also hope to increase its efficiency in energy usage by promoting energy conservation, efficient clean technologies and new techniques of oil extraction and exploration.

However all this needs money but due to the fact that the low price of subsidized fuel discourage investments in the above projects due to low profit and hence will prohibit any further development.  With the current trend towards less pollution and CO2 emition, governments will find it difficult to achieve this objective as long as the subsidy on fuel is not removed.


  1. Artificially created competitiveness. Fuel subsidy help increase competitiveness artificially. By subsidizing, the government hoped to create economic activity by reducing the cost of living and also the cost of production. Subsidies are like cocaine to drug addicts. Once they are implemented they are very difficult to remove.  Industries tend to depend on artificially low price electricity, fuel and etc, in order to stay competitive. Once lifted or reduced, they are unable to compete internationally due to the sudden increase in cost.  

Moreover due to subsidies most national oil corporation like Pertamina in Indonesia and Petrobras in Brazil incurred hugh losses. Bailout will be in the form of tax payers money. Bailing out with tax payers fund means less funds available for other development projects.

Worse still, like the case of Indonesia, it had turned from being an oil exporting country to an oil importing country in 2004. Being an oil importing country mean more funds will be flowing out of the country and hence will increase its balance of payments deficits.  


  1. Subsidies become entrenched. Once subsidies are given to any sector of the economy, it is very difficult to revoke. Studies have shown that the main beneficiaries of subsidies are the politically connected cronies. In other words it encourage crony capitalism and corruption. These are people that are responsible for the diversion of the subsidized products to the black market and industrial uses.

Profits made form these illegal businesses will be directed back to the politicians through future election campaign contributions. It is more of a culture of ‘you scratch my back and I will scratch yours’.

What are the Solutions?


Some of the following solutions have been implemented and some are still in the evaluation stage.


  1. Use of special dye to color the subsidized fuel. This will make life easier for enforcement offices to detect illegal subsidized fuel sold to industrial customers. However those middlemen have somehow perfected the art of neutralizing the color of the dye by adding natural clay to it.


  1. Fitting GPS equipments and RFID chips implant into the fuel transport trucks to track their movements and deter any mishandling of the product during transition.

  1. Provide cash to low income families as a form of compensation. It is called Bantuan Langsung Tunai in Indonesia.


  1. Quota or coupon based on previous month sales. For example in Malaysia the quota for diesel for fisherman is determined by the amount of fish they caught.


  1. Implementing a 50km demarcation zone. In Malaysia foreign owned vehicles from Thailand and Singapore are not allowed to fill up their tanks in any petrol stations that fall between the 50 km zone from the customs check points.

  1. Provide smart cards. Only certain groups of the economy are allowed to use subsidized fuel. Fuels like diesel can only be purchase by showing the smart card.

In Conclusion, we view that a country’s fuel subsidy should be removed on a gradual scale before its economy can move up on the competitive ladder. It is not a question of should but when.Policy makers will have to choose between ‘short term pain and long term gain’ or ‘short term gain and long term pain’.
A parallel comparison will be the financial crisis currently facing the Western World. They are now living on borrowed time. They are able to delay the day of reckoning by bailing out loss making banks and corporations and injecting more funds to pop up the economy. That will come to a point where the Law of Diminishing Returns will prevail and further injection of funds into the economy will not produce any more economic benefits.
By then it will be too late because the bubble is too big to be managed, debts are too big to be repaid,losses are too big to be comprehend, prices are rocketing too high to be controlled and in the end economic implosion will be the consequence.
When removing the subsidy, the government will also need to do its part by redirecting the funds to finance High Impact Projects such as public transport, infrastructure spending like resurfacing and building of new roads, bridges, schools for education, electricity generation, communication infrastructure and also a better health care system.

A transparent and accountable government must always ensure that most of its public policies are people friendly, accountable and transparent. This will eventually lead to a reduction in corruption and with its people oriented policies it can then build a trust between its people and the government.