Bretton Woods System
By protectionist policy we meant setting up of artificial trade barriers like increased import duties, subsidies for so called ‘infant and export oriented’ industries and setting of quotas among nations. This is the exact opposite to free trade which promotes the smooth flow of international trade without any barriers. The situation had gotten worse and as a result there was a call for a new International Monetary System. In July 1944, delegates from 44 countries gathered at the United Nations ‘Monetary and Financial Conference’ in Bretton Woods, New Hampshire. There are two main agenda that are discussed during the Conference which is to introduce a new international financial monetary system to stabilize the current currency woes and also on the recovery of Europe after the WWII to prevent any recurrence of the problem.
Under the Bretton Woods system member countries are required to peg their currencies to the dollar and are allowed to fluctuate within a fixed trading band and also permitted to convert their dollar holdings to gold at the rate of $35 an ounce. It is only the natural thing to do because during that time the US economy is accounted for almost half of the global manufacturing capacity and also holds the world’s largest gold reserve. To facilitate the changes in the monetary system two international institutions are formed and they are the IMF (International Monetary Fund) and the World Bank. Apart from providing loans for the reconstruction of Europe post WWII it is also hope to stabilize the currency fluctuations so as to avoid future currency wars again. However over the long term such arrangement proved cumbersome due to the changes in the currency’s purchasing power parities (PPP).
Purchasing Power Parity
PPP refers to the value of basket of goods in two countries should be equal to the ratio of their exchange rates. For example if the exchange rate between the USD/MYR is 3.20 then a basket of goods consist of chicken, beef, eggs, flour, sugar and cooking oil that costs US100 in the U.S then the same basket of goods should be worth RM320 in Malaysia. However such scenario will not often played out as expected due to both traded and non-traded inputs.
A good example will be the Big Mac index which is developed by the Economist illustrates the difference in the PPP of different countries. By definition a Big Mac cost US4.20 in the U.S should costs RM 13.44 (US4.20 x 3.2) in Malaysia. A check at a McDonald’s restaurant in Malaysia reveals that a Big Mac only cost RM 7.95 and convert it to US dollars it will translate to (7.95/3.2 = 2.48) US 2.48. This represents a (US2.48/US4.2) 59% discount in pricing on the Malaysian side. So in theory based on the PPP the Malaysian Ringgit is 59% undervalue and in the long run should appreciate upwards until it reaches parity with the USD. The full extent of the Big Mac Index can be shown in the following.

On the left are countries whose currencies are undervalued while those on the right are overvalued. The difference in currency values are attributed to both tradable and non-tradable inputs. In less developed countries certain goods and services such as labour and raw materials are cheaper and hence the end product in this case a Big Mac will be cheaper. So as you can see the imbalances in the purchasing power parity of the different currencies will somehow has to move towards a more equitable level in the future.
One of the solutions will be the arbitrage of labour and resources through Foreign Direct Investments (FDI). Through FDIs companies from more developed nations are able to take advantage of the availability of cheap labour and resources in less developed countries. Furthermore FDIs will also help to reduce the currency imbalances when foreign companies convert their currencies to the local currency.
Triffin’s Dilemma
So coming back to our discussion on the exchange rates between countries under the Bretton Woods system, there will be parity problems because they are pegged to the USD. Member countries are not permitted to meddle with their exchange rates and hence as a result some of them are burdened by either their overvalued or undervalued currencies. Without the ability to adjust their exchange rates countries will find it very difficult to achieve both internal and external balance. Sooner or later the currency peg under this system will be under tremendous pressure and eventually will have to give way. In 1959 Robert Triffin also known for his (Triffin’s Dilemma) warned that the Bretton Woods system cannot survive because in order for the dollar to be continued as ‘the world reserve currency’ it had to supply more dollars and run ever bigger deficits.
The mechanics of it can be explained by the following. When the USD becomes the World’s reserve currency it will be the currency of choice by the world’s central banks when they build up their foreign reserves. Due to the popularity of the USD and hence an ever growing demand for it the value of the USD will keep appreciating. When a currency appreciates it will be cheaper to import and expensive to export. Hence as a result the deficits will be growing larger over time.
However the growth of Money Supply in the Unites States seems to be on an exponential path as shown by the chart below. As with anything when the supply exceeds demand its value will have to drop.

The following chart shows the United States Dollar index whose performance is measured against a basket of other currencies such as EUR, JPY, GBP, CAD, CHF and SEK. As can be seen its value seen tumbling since the 1980s which is also coincide with the increase in the money supply during that period then.
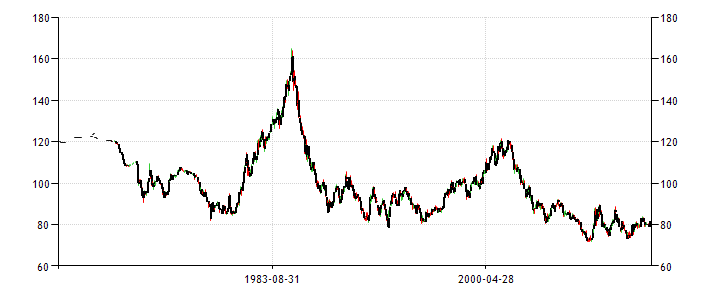
Source : Trading Economics
Bretton Woods and Fractional Reserve Banking
The Bretton Woods system operates in a similar way as the ‘Fractional Reserve’ system operates by the Banking industry. In the banking system deposits are used to leverage the bank’s ability to lend. For every dollar deposited the bank is able lend out more than $10 after allocated a certain amount for the deposit reserve ratio. It will be safe as long as all the depositors will not concurrently demand cash for their deposits. In other words when there is no ‘bank run’. Similarly in the Bretton Woods system it is dealing with Gold and USD. The member countries (holders of USD) were given the impression that there is enough gold for everyone. However Triffin realized that as time goes by the amount of trade between countries will grow and hence the demand for USD will also increase. The problem is that there will come a time when the total dollar holdings by foreign central banks will exceed the amount of gold held by the United States.
What will happen if foreign holders of USD simultaneously convert their USD holdings to gold at $35 an ounce? This is exactly what happened during the late 1960s. During that time the balance of payment deteriorated badly and there are fears of the Dollar devaluation. As a result many foreign holders of USD began to cash in their dollars for gold. This trend grew so fast and substantial where the U.S gold stock reduced by almost 70%. In other words there is a ‘Gold Run’ going on. So to prevent further depletion of its Gold Reserves, President Nixon on August 15th 1971 announced that foreign dollar holders are no longer able to convert their dollars to Gold. Hence the USD is no longer backed by Gold and instead it is transformed into the ‘reserve currency of the world’ and is ‘backed by full faith and credit of the United States’. This brought an end to the Bretton Woods system and later the USD is allowed to ‘float’ with other currencies.
Nevertheless the deficits still remained after more than 30 years since then. The following chart shows the extent of the U.S deficits since the 1980s.
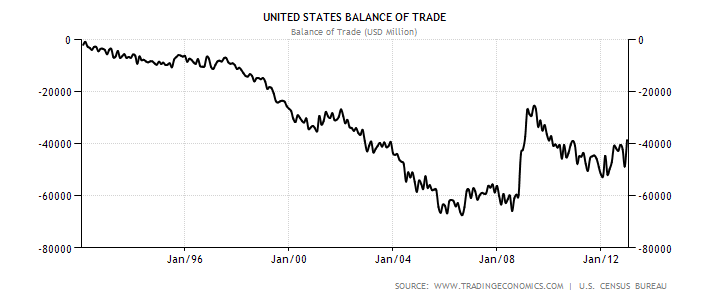
The reason why the United States is able to run deficits for more than 30 years is mainly due to the status of the dollar as the reserve currency of the world. Foreign central banks are obliged to keep their foreign reserves in dollars as it is also the currency of trade. Most commodities like oil, gold, corn, wheat and etc are quoted in dollars. Whenever a foreign country exports to the United States it will be paid in dollars. Those dollars will make its way to the foreign central bank which in turn will be recycled back to the United States in the form of purchase of dollar denominated assets or U.S Treasury Bills. Or they can add it to the foreign reserves. Can you notice there is a dilemma here? As time goes by the amount of USD accumulated by foreign dollar holders will multiplied and it is not in their interest to see the dollar ‘race towards zero’. If the dollar losses more value then naturally the value of their dollar holdings and dollar denominated assets will also go down. Put it another way the foreign dollar holders are trapped.
So are there any solutions available?
The first measure available to dollar holding countries is to stop adding more dollars to their reserves but instead diversify their future holdings of foreign reserve in other currencies such as the Euro or the Japanese Yen.
The second measure to counter the depreciating value of the USD is to trade using other currencies or even gold. Malaysia has already set several precedents when it paid the Chinese Government with palm oil for their work and finances in a railway project and also with Russia when it purchased some MIG fighter jets. In fact many countries have already started trading bypassing the use of dollar. India announced last month that it will begin to buy oil from Iran with gold and not dollars. On September 2012 China also announced its intention to sell oil denominated with the Yuan. So as you can see the exodus from dollar denominated trade is gaining speed and sooner or later the USD is going to lose its importance as the world’s reserve currency.