Thursday, April 25, 2013

Is our Government's Subsidy Removal Policy a Wealth Redistribution Program?


It is a known fact that Central Banks around the world are shading and twisting their economic data. The main reason being to hid from us the truth about the health of our economy. If you can remember during May 2010, Minister Idris Jala announced that Malaysia is going to be bankrupt by 2019, if nothing is being done. He blamed it on the subsidy system and recommends that the government should remove the subsidies gradually. Subsidy is a very sensitive economic tool and has been in used for more than a century especially in the agriculture sector in Western Economies. Farmers are subsidized so that their produce remained competitive in world markets and at the same time also helped to provide employment back home. The effectiveness of subsidies can be viewed from different angles, some argued that it leads to an inefficient allocation of resources while others viewed it as essential in providing some protection to certain sectors of the economy so that it will ensure the constant supply of strategic resources like food and also provides full employment.

The question is whether our removal of the subsidies done at the right time? Remember during that time our economy was just recovering from the 2008 Global Financial Crisis which affected much of the population. Would it be the right decision for policy makers to curtail the spending of the public when it was during the very crucial time where curtailing or restricting consumer spending is the last thing the economy needs. The following chart shows the Malaysian GDP annual growth rate as of 2007.


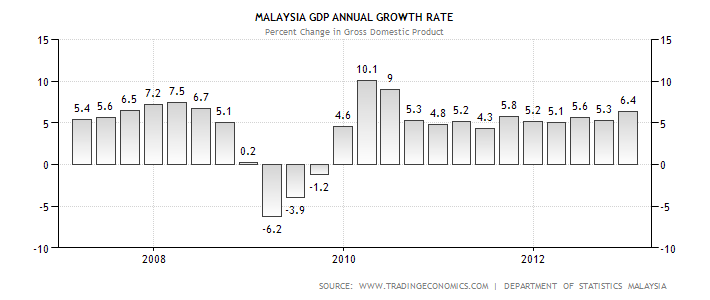
Notice that during the second quarter of 2010 the GDP growth rate was at 9% which can be considered very high and in fact is the second highest quarter since 2000 after the 10.1% achieved earlier. With such a good performance why not the government just let the economy to continue with this growth story by not interfering? You have to understand that in order to sustain such a high growth rate, Government expenditure will also need to be increased. Where will the extra funds be coming from? How can Idris Jala announced (May 2010) that our country is going bankrupt at the very moment when our economy was recovering with such spectacular growth rate. Isn’t it strange or do they have other hidden agendas behind all these?

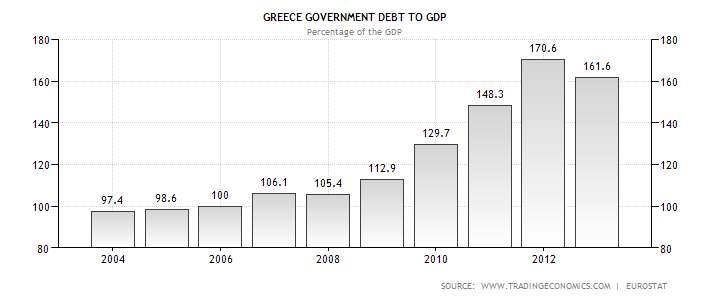
Let take a look at our Government Debt to GDP ratio in the following chart. Did you notice that our Government Debt/GDP suddenly surged from 42.8% in 2009 to 55.4% in 2010? This represents an increase of 29.4% YOY increase in our government debt. One explanation for his will be the massive borrowing by our government to finance its increased expenditure on both the fiscal and monetary policies. Or what is also known as the stimulus package to fence off a recession.


How does our Government finances its expenditure?

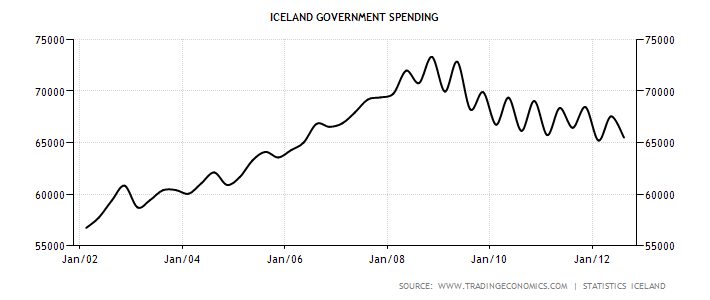
For any recovery to be sustainable, initially the government will have to lead the way by increasing its own spending in the fiscal and monetary framework. Once this gets underway and with the improved expectations of better days ahead then the next wave is to encourage the private sector which consists of the business and consumers to spend more so as to increase the level of economic activity. Before we go further let us take a look at the pattern of our Government spending for the past 6 years in the following chart.


As you can see from the above our Government spending has always been on the uptrend even before the Global Financial Crisis in 2008. It peaked during the last quarter in 2012 which is recorded at 32624 MYR millions. So how do our Government finance its expenditure?
In normal market conditions any Government will finance its expenditure either through increase borrowing or taxes. Increasing taxes at this moment of time will be politically suicidal for our government due to the coming General Elections as nobody likes to pay more taxes. If it proceeds then it will certainly be the last nail in the coffin for the government.
The other alternative is to increase borrowing which is also going to be suicidal because in the Constitution the ‘ceiling’ for our Government Debt/GDP is stated at 55%. As you can see during the year of 2010 it is has already breached the 55% threshold although by only 0.4%. In other words the Government cannot afford to borrow more from external sources as this will surely bring the ratio above the 55% mark very soon. So where can it get more funds to finance its ever increasing expenditure without increasing taxes and borrowings? The answer is by reducing the subsidies.

Why reduce subsidies?

During his speech in May 2010, Idris Jala threatened that without any reduction in the subsidies our Government will surely go bankrupt by 2019. The question : Is there any difference between Idris Jala and Henry Paulson (U.S Secretary of Treasury) when he pushed through legislation authorizing the Treasury to approve the US$700 billion TARP to bail out the financial system? According to him without the approval it will not only undermine the U.S financial system but the whole world as a result of the domino effect. The answer is NO bloody difference. They are both using scare tactics so that the public will be bowed to their demands.

Our Government controlled parrots (mainstream media) claimed that by reducing subsidies it will helped unlock inefficient resources so that it can be used for other purposes such as building infrastructures, schools, public transport and so on which in the end will benefit the public. During any economic recovery the last thing any Government need to do is to dampen consumer spending.

Why subsidy reduction will not affect Government Debts?

When a Government overshoots its expenditure it needs to borrow or increase taxes in order to finance this activity. As we already stated increasing taxes is not a popular option and most Government will try to avoid. This leaves us with borrowing as the other option. Again when we borrow from foreign creditors then our Government Debt to GDP will increase and since our level is capped at 55%, there is not much option right? The last alternative will be to source from domestic. Again sourcing funds from the domestic sector will further increase the debt burden. So the last solution is by soaking up money from the public. The question is how the authorities going to do it?

According to the French Economist Jean Baptiste Say (1767-1832) who said that the spending for production simultaneously generates income for the people to buy all the goods produced. In the end the buying power will help clear the inventory and hence provide full employment. In short it means that the demand for goods will be equal to the supply of goods. But our problem is how do we quantify the demand and supply in the equation. Fortunately the solution to this problem can be found in Dr Irving Fisher’s equation of exchange. In Dr Fisher’s equation the demand is represented by MV and the supply is PT which is equal to GNP. GNP (Gross National Product) is the dollar value of all the goods and services currently produced in the economy. Or it can be express in the following algebraic equation.

MV = PT = GNP where,

M = Money Supply

V = Velocity of Money

P = Average price of current production

T = Total volume of current production
Through the Keynesian model we also know that,

GNP = C + I + G where,

C = Private consumption

I = Investment

G = Government spending

So how do we connect all this mumbo jumbo? To illustrate we use an example where the total GNP for country A is $100 million and the breakdown of the GNP is as below.

Consumption
50
Investment
20
Government
30
Total             RM
100

However Government spending can be further breakdown into education, defence, subsidy and etc. So by diverting resources from subsidy to other sectors such as defence or infrastructure there will be no change in the final amount which is $30 million. The only change is the composition of the spending and in this case a reduction in subsidy and an increase in defence and infrastructure expenditure.

So what we can deduce from here is that whenever the Government borrows or divert resources from other sources where the source of money is already in existence it will not add to existing money supply. This is what economists called non-monetized borrowing or non-monetized deficit financing. This is mainly paper shuffling and hence will not affect the Government Debt level.
Our next question is what will be the immediate effect of a subsidy reduction?    

Will the reduction in subsidies cause price inflation?

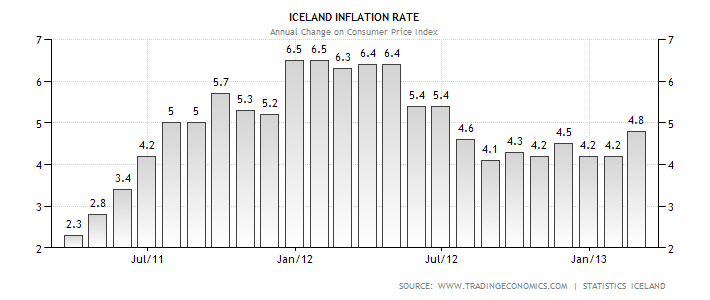
The amount of subsidy is expected to drop to RM37.61 billion in 2013 from RM42.4 billion in 2012 which represents about 4% of GDP. As you know the bulk of the subsidy went to fuel which accounted for about RM25 billion or 23% of the total. So what will happen to the price of fuel when the Government reduces its fuel subsidy over the next few years? Needless to say it will go up and as we know fuel is used in almost all industries from transport to the manufacturing of plastic materials. With its ‘trickle down’ effect needless to say it will push up the prices of most products or what is called a ‘cost push inflation’. In layman terms this is called price inflation. The following chart shows the CPI (Consumer Price Index) which tracks the prices of certain essential goods paid by consumers.

As you can see from above as of January 2013 our Malaysian CPI increased to 106.20 index points from 99.3 index points in 2010. The level recorded in 2010 is actually the mean for the last 5 years. So as you can see after the implementation of the subsidy reduction the prices of our goods really went up. So, in the end who will end up paying the cost for the price inflation? It will be ordinary folks that is most affected and where did the excess money gained from reduced subsidy went to? Public projects such related to ETP such as the MRT, new Highways, oil and gas and etc, soaked up all of that.  And who are the people that got the contracts? Not me and you for sure. So what are we witnessing is actually a redistribution of income from the poor to the rich. If left uncheck the income gap between the poor and rich will be wider.


Thursday, April 11, 2013

Using the Monte Carlo Method to improve your Investment Decisions


To a lot of people the mention of Monte Carlo will automatically refer to the resort town in Monaco but in actual fact it is a technique developed by scientists while working on nuclear weapons which requires simulations.It invented during the 1940s by a Mathematician named Stanislaw Ulam, while he was working on nuclear weapons project at Los Amos Laboratory. The Monte Carlo Method is often used for simulating systems or projects that have many uncertain or random inputs. In finance it is used to create different models to solve different problem arising from finance such as simulating the stability of the financial system, how much money a company will lose in a given amount of time (VaR) and so on. Since then it has been used in various industries such as Finance (risk control), manufacturing (soap to semiconductor), operational research, project management,  engineering, oil & gas, transportation (traffic lights), environmental control and many more.


Common users of the Monte Carlo Method in the financial industry can be found in insurance companies where it is used for calculating the risk of the company going insolvent. The solvency of any company depends on whether its assets are bigger than its liabilities. Since the assets and liabilities of insurance companies depended on the claim, inflation rates, returns on investment from fixed income, income from both renew and new policies the outcome can be considered uncertain.


So in order to know what are the scenarios on the solvency of the company in the next few months or up to a few years they need to simulate a model whereby they can estimate the assets and liabilities in advance. With the given number of random inputs, The Monte Carlo Method will produce simulations that will generate tens if not hundreds of thousands of outcome or different scenarios or probabilistic distribution as is known in Mathematics. This can be summarized and then plotted into graphs and histograms and will help produce better answers.


Is Cash Better than Stocks?


To illustrate the use of the Monte Carlo Method in helping us in our everyday investing decisions we shall use the following model which is a result of the research done by the York University of Ontario.


Case Study:
  1. You re given a $10,000 inheritance
  2. What will be your choice? Invest everything in Stocks or deposit it into Certificate of Deposits.
  3. Currently the CD is paying an interest rate of 5%
  4. Your problem is whether your Portfolio of U.S securities will outperform the 5% interest from the CD in 1,5,10,20 years?


The researchers have constructed the following table with the aid of the Monte Carlo Method in simulating different scenarios on whether the Portfolio of U.S securities will outperform the 5% yield from the CD.

Table 1. Probability of Underperformance
Time in Years
Underperform in %
1
34.83
2
29.06
3
24.97
4
21.77
5
19.16
10
10.87
20
4.06
25
2.56
30
1.63
35
1.05
Source : Professor Moshe, York University

From the above we can deduce that there is a 34.83% chance that the Portfolio of securities will underperform the 5% yield from the CD. Further to that you should notice that the percentage gone down to 10.87% after 10 years. Put it another way there is a 89.13% chance that your Portfolio will beat the performance of your CD. The longer the time horizon the better the chance your portfolio beating the 5% return from the CD. If you can wait another 10 years the chances of your portfolio outperforming is 95.94%. In other words the longer the timespan the safer will be your portfolio and hence the risk.

The above table also offers you the choice of different time period of risk and return to your portfolio. If you think that you need the money within 5years time to finance your child’s education, then you know that your chance of beating the return from the CD is 80.84%. Or put it another way your chance of underperforming is only 19.16%.

So basically the above table can help you in making your investing decisions based on the risk and time interval. It also shows you that the longer the time interval the safer will be your investments and hence produce a better than expected return than the CDs.

In the next few articles we will touch on how to use the Monte Carlo Method in helping you make decisions in Asset Allocation, Trading with margin, Diversification and etc.

Wednesday, April 10, 2013

Why Bank Bail-in and Bail-out (BIBO) wont work. Case Study : Greece and Iceland


As most of us can remember that Iceland was the first country that went down during the last Global Financial Crisis in 2008. During that time Iceland had done something remarkable and that is during the five years prior to the crisis, managed to transform its economy from a fishing industry to a mega hedge fund country. Many of its citizens left their traditional trade which is fishing to become fund managers and salesman. As a result Iceland’s banking assets (physical assets + Loans + Reserves + Investment securities) grown to more than 10x its GDP of $14 billion.  With such high leverage, when the financial crisis struck it is unable to defend its economy and hence its house of cards collapsed.


The purpose of this article is a post-event analysis of the performance of the Icelandic economy that refuses a bailout as compared to Greece which went for a bailout with the injection of funds from Troika. To simplify matters, we shall coin the bail-in and bail-out as (BIBO) for short. Of course in the short term it helped stabilized the Greek economy for a while but we want to know to what extent it had transformed the Greek economy in the long run with the accompanying terms and conditions and austerity measures. In this article we shall compare the performance of both the economies of Iceland and Greece with the economic indicators or metrics below from the year 2002 to the present. We believed we have been fed with too much toxics by the mainstream medias which are also own by them that capitalized on the age old investment axiom of good-to-good.


Does Government do what’s right for us?

We have led to believed or should we say brought up with the perception that when someone does well then he/she will be blessed in return. Hence it gave rise to an old age investment axiom of good-to-good and bad-to-bad reaction which can be translate to good action leads to good reaction. So we always believed that whatever our Government does it will be for the better of us. So when they bailed out the banks, we believed that they are doing the right thing and we should leave everything in their good hands and expect good reaction. Right? WRONG ! We shall show you on our analysis below that whatever our Government does is not necessary the right thing to do. We have based our analysis on the following indicators or metrics.


  1. GDP per Capita
  2. Inflation rate
  3. Balance of Trade
  4. Government Debt to GDP
  5. Government 10Y bond
  6. Government Spending
  7. Consumer Spending
   
The following is a review of the Icelandic economy which not only refuses a bailout of its banks but instead bankrupting them. They are taking a big risk to take things into their own hands instead of letting the bankers running their country. They are going off the beaten path and from our analysis we reckoned that they have done the right thing. Below we compare the economies of two different countries that have taken different paths – one that receive bailouts (Greece) and the other (Iceland) refuses bailouts. The first metric we are using is the GDP per Capita.


  1. GDP Per Capita ratio

The first metric that we are going to compare is the GDP/Capita ratio. GDP/Capita also shows the standard of living of a particular country and a higher ratio normally denotes a higher standard of living. As you can see from the charts 1a & 1b below Greece seems still to be on the plunging mode and somehow there seems to be no slowing down in sight and hence a floor has yet to be set. Whereas Iceland seem to be going on a firmer footing when its GDP/Capita ratio seems to be stabilizing around 2011 and it seems to be on the uptrend. Iceland’s current (2012) ratio seems to be heading back towards the 2006 level whereas Greece’s is heading backwards to the 2003 level.


Chart 1a & 1b (GDP Per Capita)


  1. Inflation Rate

The second metric is the Inflation rate. From Chart 2a below it seems like Greece’s might be facing the risk of a deflationary spiral as happened to Japan in the 1990s.  Its inflation rate has fallen from 4.5% in April 2011 to 0.1% in February 2013. Once the economy sets it path on a deflationary mode it is very difficult to reflate it back to the preferred long term inflation rate of 1-2 % above zero. Japan will be a good example when its economy was gripped by the deflationary forces since the 1990s, eventually it ended with 2 lost decades of growth. Only recently newly elected Prime Minister Mr Shinzo Abe is committed to reflate Japan’s economy at any cost.  On the other hand Iceland’s inflation rate is now at 4.8% which is hovering around the mean of (4.7%) for the past three years and considered to be manageable and essential for economic growth.


Chart 2a & 2b (Inflation Rate)


  1. Balance of Trade

The third metric is the Balance of Trade which is also can be defined as difference between the exports and imports in monetary terms. From Chart 3a it is very obvious that Greece has been running trade deficits for the past 24 months consecutively. Negative trade deficits means there is a net outflow of money from Greece. This means that Greece may need to borrow more in future in order to finance its government expenditure and hence will incur more debts in its coffer. As for Iceland it is a different story where out of the 24 months 19 of them are experiencing positive balance of trade. Positive balance of trade means positive net inflow of funds and hence it enable the Icelandic government either quicken their repayment of debts or embark on new government fiscal expenditures without resorting to more borrowing.

 
Chart 3a & 3b (Balance of Trade)


  1. Government Debt/GDP

Next is the Government Debt/GDP ratio or the total amount a country has as in percentage of its GDP. It seems that Greece’s Debt/GDP ratio is currently way above 100% and as of end of 2012 it at 161.6%. A high Debt/GDP means more funds are needed for interest payments and hence less will be available for development. We will foresee this trend will extend much further into the future because 1) its ratio is still considered dangerously high and 2) many of its economic indicators are still recording negative readings and hence may dampen its ability to quicken its repayment schedule.

It should be of immediate concern for any government to bring down their debt ratio to below 100% and preferably in the long term to below 50% which is more manageable. If not it will risked being entangled into a ‘Debt Trap’ meaning more new money needed to borrow to cover the previous debts. When this goes on eventually a country will have to succumb to its debts burden and collapsed.

As for Iceland, although its ratio is at 99.2% which seems critical but at a close look at it looks like the ratio is hitting a plateau in the last three years. The debt growth seems to be tapering off although there is a big jump since 2008. This can be explained by the increased in the borrowings after the crisis to finance its development costs.

Chart 4a & 4b (Government Debt to GDP)


  1. 10y Government Bond

Our next metric is the 10y Government Bonds. The yield on the Government Bonds reflects the expected inflation rate and also the ability of the issuing Government to repay its debts. The higher the expected risk the higher the yield will be demanded by investors. As of yesterday’s closing Greek Government 10Y bond, yield 12.79% which can be considered very high. That means that the Greek Government is paying more for its funds. As for Iceland its 10Y bond only yields 6.4% which means the Government can borrow at a lower interest rate because investors have more confidence in getting their money back.
  

Chart 5a & 5b (Government 10yr Bonds)


Source : Tradingeconomics.com


  1. Government Spending

The sixth indicator is the Government spending. This is the part where the Government spend on public services such as roads, bridges, schools, defence and other public projects for the betterment of its citizens. It seems like the Greek Government is doing the opposite. To reflate an economy its government will have to increase spending through its expansionary fiscal and monetary policies. Without the government taking the lead by increasing its spending so as to boost the confidence in the economy there is no way the private sector is going to initiate such a move.

As can be seen from the chart 6a below, there is a contraction in spending by the Greek government. By spending less, how can the Greek government instil economic growth and hence create jobs and help increase confidence among its consumers which eventually leads to increase spending. This also helps to explain why the inflation rate (prices) in the Greek economy kept falling. The Greeks will have no choice but to reflate its economy or else risk going into a deflation.

On the other hand Iceland seems to be stabilizing on its Government spending and thus able avoid any deflationary pressure on its economy in the future. A quick look revealed that the Greek government spending as of 2012 has fallen to less than it had in 2002.


Chart 6a & 6b (Government Spending)


  1. Consumer Spending

Consumer spending is an important economic indicator because many economies depended on the consumption of their consumers to generate growth in their respective industries and hence the economy.  As we have mentioned above without the Government taking the initial steps to increase spending, the private sector will not be motivated to do so. This is a classic case of ‘Paradox of Thrift’ meaning the more you save and the less money you spend the worse off will be the economy. This is because when everyone is cautious and not spending then how can this help to boost the economy. When economic activity is slowed so will be the velocity of money and thus there will be a limited multiplier effect on the economy.

As you can see from the charts below since 2008, Icelandic consumers have been increasing their spending since 2009 whereas Greek consumers spending only seem to be improving since last year. So it will not be a surprise if the Icelandic economy rebound much sooner and hence performed much better than the Greek economy in the coming years.

Chart 7a & 7b (Consumer Spending)


Why Bank Bail-ins and Bail-outs (BIBO) will not work?

Short answer:
It violated some tenets of market economy such as interfering with the free flow of capital and also the neglect of the consumer economy.

Long Answer :

In the ‘Wealth of Nations’, Adam Smith pointed out that,
“To increase the wealth of a nation, he argued that society should exploit the natural drives or propensity to bettering their conditions of the people. Government should not repress self-interested people, for self-interested people is a rich natural resource. People would be fools and nations will be impoverished if they depended on charity and altruism”.

He also states that under a market system, the free flow of goods, services and capital even the poor and politically impotent can survive. In a market economy there will be less government which also means more freedom and laissez-faire in the economy. In contrast under a centrally planned system political power determine economic position where only the friends of the kings and lords can grow rich. Or shall we say centrally planned system breeds corruption and cronyism.

According to him under the market system, the invisible hand through prices and profits will determine not only what and how much to produce but also what price to charge. High prices will lead to high profits and this will sound alarm bells to the competitors to start producing more of that product and eventually will drive prices down to point where only normal profits can be earned.

In other words there should be no intervention in the flow of goods, services and capital in a market economy for if the government starts interfering then it is a signal that it is moving towards a non-market or centrally planned economy. If the invisible hand fails to regulate the economy then there will either be shortages or over production (excesses) of goods produced. Firms that are unable to respond to such situations will be driven out of business. This is where Joseph Schumpeter’s ‘Creative Destruction’ will work its way into the economy. In Schumpeter’s creative destruction it is a case for survival of the fittest. Young innovative and efficient will replace old, inefficient and unproductive companies so that the economy can regenerates itself again to be more dynamic.

For the past decades the economies of the Western World has gradually transformed from a ‘Keynesian model to a Monetarist model’. Keynesians believed in using Government expenditure and taxes to encourage or discourage economic growth. In times of economic slowdown the government will increase spending and lower taxes and vice versa. On the contrary the Monetarists believed in the use of money supply to solve its economic problems. In times of economic downturn the money supply should be increased to encourage more spending in the economy and vice versa.

However for the the past few years since the Global Financial Crisis in 2008, the Monetarist realized that the use of Quantitative Easing to increase the Money Supply so as to lift their economies from recession does not work. As a result,The Monetarist in the Western world today are moving towards more government intervention in its allocation of goods, services and capital. The government decides not only on which companies are getting the bailouts and who are paying the taxes but also how much while at the same time neglecting the masses. As a result of this misallocation of resources shortages and excesses are appearing in areas that are not supposed to be.

The current mutation from a market to non-market economy will be complete when its people starts asking : Who the hell is in charge of food production in this country? In a non-market economy the answer will be the government but in a market economy it is NOBODY. You may ask why? The answer lies with Adam Smith’s invisible hand that performs its magic behind the scenes. As an example, in bread production the consumer does not know the bakery owner, the bakery owner does not know the farmer and similarly the flour producer does not know the land owner. Prices and profits will help to decide on what type and how much of different type of bread to be produced.

Conclusion

In conclusion we would like to point out that agreeing to bail outs sometimes is not the right solution in fixing the economy. It will helped stabilized the economy in the short term but in the long term it will have to pay the price. Iceland had done some bold moves by refusing bailouts and hence bankrupting its banks. So it might be a precedent for other countries to follow if it works.

Finally the following are the credit ratings of Greece and Iceland from various credit rating agencies.

Ratings Agency
Iceland
Greece
Standard & Poor
BBB-
B-
Moodys
Baa3
C
Fitch's Rating
BBB-
CCC

Source : Trading Economics

From the above, needless to say whether Greece or Iceland has made the right decision. The result speaks for itself.