Proton or (Perusahaan Otomobil Nasional Berhad) was incepted in 1985 by the then Prime Minister of Malaysia with the hope that it will help Malaysia hasten its industrialisation program in order achieve a develop nation status by 2020. Mahathir reckoned that to complement this vision a ‘national car’ program will be best option to fast track the process. His penchant for starting up a ‘national car’ program is partly due to the success of other countries in their ‘national car’ project which subsequently progresses into nurturing successful car manufacturers and a chain of parts suppliers. To understand a bit on the history of ‘national car’ we present below the time line of various country’s national car project.
Country
|
Year Started
|
Australia
|
1944
|
Japan
|
1965
|
South Korea
|
1974
|
Indonesia
|
1976
|
India
|
1982
|
Malaysia
|
1985
|
One thing to note is that all of them are successful except Malaysia and Indonesia. Australia started off its ‘national car’ project in cooperation with U.S car conglomerate General Motors in 1944. As a result of the cooperation and design based on the Chevrolet a national icon by the name of Holden was born. Although Japan’s car industry begin much earlier when Mitsubishi join venture with Fiat to produce the Mitsubishi Model A. It was only during the 1960s where MITI (Ministry of Trade and Industry) really take the car industry seriously. It embarked on a policy to build a ‘national car’ project to make cars more affordable for its people.
South Korea initiated its ‘national car’ policy in 1974 after envying the success of the Japanese with KIA partnering Honda and Mazda. Since the 1970s, Indonesia had as many as 15 national cars that come and go that include local names like Marlib, Bimantara, Timor, Morina and so on. India started its ‘national car’ project in 1982 which resulted with the production of Maruti which is a joint venture with Suzuki. Lastly, Malaysia followed suit and started its ‘national car’ in 1985 with Mitsubishi Motors as its partner.
Mitsubishi Motors Japan was rope in to act as both its partner and components supplier. As a result a car manufacturing plant with an initial capacity of 80,000 units per year was built in Shah Alam to serve the purpose.
Actually it was the beginning of a nightmare to all Malaysians – young and old – and it still continued till today due to the high tariffs imposed on imported cars. As a result consumers had no choice but to buy our national car. Due to the monopolistic nature of the business model there is less incentive to upgrade and improve the quality of its cars. Proton designs are dated and outdated models are still available even though it has been in the market for more than 10 years.
For a start getting Mitsubishi Motors as a partner was wrong from the beginning because Mitsubishi Motors is known to be a failing car manufacturer with depleting sales for years. Its sales are lagging behind Honda and Toyota for years due to design and quality issues. Apparently at the beginning it was Nissan and Toyota was shortlisted to be Proton’s partner but somehow Mahathir changed his mind on advised by Kenichi Ohmae from McKinsey & Co Japan and eventually partnered with Mitsubishi Motors.
Why Proton Failed?
As you know, Proton as a new player will not able to survive the competitive automobile market without any help from the Government. This is fair because in other countries their Government also helped their car manufacturers at their beginning so as to provide an artificial head start. Hence Proton being in an ‘infant industry’ also received Government protection in the form of import tariffs hike for all imported cars. As a result of the price hike, it suddenly made imported cars prohibitive to own and consumers are left with no other choice but Proton.
Through Petronas and tax payers money, the Government poured in RM Billions into Proton not only to keep its car prices low but also to protect those employed by Proton directly and indirectly through its ‘high priced crony linked suppliers’. When business is linked to politics then excesses and imbalances in resources allocation will be created. This will result not only in low quality and uncompetitive pricing in the end product but also lack of drive and self-esteem to innovate within the organization.
Proton also has too much political baggage to carry from the supply chain to the Distribution channel where it is linked to UMNO. Its monopoly on the low end consumer car segment enables it not only to have good margins but also provide very bad after sales service. After sales service is not known to be top notch and quality is still a suspect in areas like power window and funny sounds appearing from unknown source. On top of the RM billions in Grants poured into the R & D to develop new engines and other products ended up nowhere. Without accountability and transparency it will be a miracle if Proton can move on to the next level in car manufacturing. Below is the chart of Proton’s automobile car sales in Malaysia from 2002-2012.

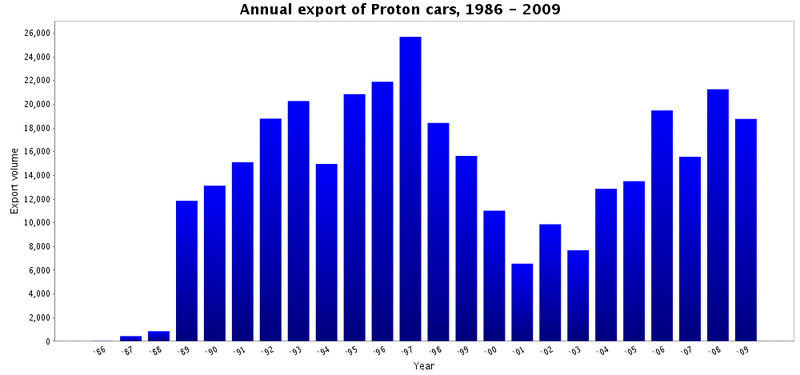
On the export front Proton is losing market share in the UK to companies like Hyundai and Kia. In 2010, it only managed to sell 767 cars in the UK where during the 1980s and 1990s it sold tens of thousands of cars each year. It is losing in terms of quality and design and Proton needed more than a cosmetic touch to regain market share. It needed a complete overhaul in the grand scheme of things. The recent rebadging of Mitsubishi’s Lancer as Proton Inspira will not do the magic. Instead of looking at our problems to find a solution, why not take a look at what others have done that made them successful.
Why Hyundai Succeed?
Hyundai Motor was founded in 1967 as a result of the diversification process initiated by its parent company Hyundai Construction. Hyundai Construction was formed after WWII by its founder Ju-Yung Chung who can’t speak English but somehow got his brother who knows a bit of language to help him get construction contracts from the U.S military bases. Then his construction business blossomed and with it Hyundai Construction managed to learn a thing or two from the tight specs specified by the U.S Army Corps of Engineers. Later the Hyundai group was transformed into one of the most powerful chaebols (like the Japanese Zaibatsu) in the country. Then it diversified into steel, cement and auto manufacturing.
Hyundai Motor began life by manufacturing the Cortina in a joint venture with Ford Motor. In 1975 the success of the Pony helped catapult Hyundai into being as one of the biggest car manufacturer in Korea. Being confident from the success of the Pony, Hyundai began to look to the overseas market. In 1986 Hyundai began its first foray into the overseas market by introducing the Excel into the U.S market. It was successful at the beginning but later it was abandon by the American consumers due to the bad quality. It was liken to the East European Yugos and Ladas and its ratings fell to the bottom in the J.D Power’s ranking. To a lot of car manufacturers when they hit bottom many would have abandoned the market but not Hyundai, it stayed on and turned around the company.
How did Hyundai Motor turn around?
One man that deserves to be given the credit for turning around Hyundai’s fortune is Mong Koo Chung. He gained control of the company from his father at the age of 63, after serving many years in the after sales service department. Not long after taking over the top position in the company he then visited the car plant in Ulsan to have a look at the Sonata assembly line. Upon looking at the process and the quality he shouted ‘You have to get back to basics and raise your quality standards to Toyota’s level’. Chung knows that if Hyundai were to survive he needs to do some drastic changes on the company. Among them are,
World Class Quality
Chung knew it was a monumental task of raising the quality of Hyundai cars to the level of Toyota because at that time Toyota enjoys one of the highest ranking in the J.D Power survey on quality. Slow but steady and with determination and nation pride Hyundai slowly began to upgrade its quality level. By 2005, Hyundai was listed on Business Week’s Interbrand top 100 brands in the world. It has since stayed at the top 100 brands in Interbrand’s listing. What initially started out with 272 problems per 100 cars in the late 1980s it raised its level to 102 problems per 100 cars which bettered Toyota (106) and the industry standard of 124 problems. J.D Power survey measures how many customer complaints during the 90 days of purchase.
When asked on how they managed to raise their quality rankings so fast, one engineer said that on one occasion when one of his colleagues found a small problem with wind noise in one of the new model, he dedicatedly worked on it for the next six month, rarely go home until he solved the problem.
When asked on how they managed to raise their quality rankings so fast, one engineer said that on one occasion when one of his colleagues found a small problem with wind noise in one of the new model, he dedicatedly worked on it for the next six month, rarely go home until he solved the problem.
Achieve Economies of Scale
Chung knows that in order to be competitive in this cut-throat business he had to reduce the cost of production to a minimal. This can be achieved through economies of scale and the only way to do it is by increasing its overseas sales. Currently Hyundai has 7 overseas car manufacturing plants and its total sales is as follows.
Below is chart of Hyundai’s Total car sales from 2004 – 2012.
Year
|
Sales (Million)
|
2004
|
2.1
|
2005
|
2.3
|
2006
|
2.5
|
2007
|
2.6
|
2008
|
2.7
|
2009
|
3.1
|
2010
|
3.6
|
2011
|
4.05
|
2012
|
4.4
|

It can be seen that from last year Hyundai recorded an increase of 8.6% over the previous year and in totality an increase of 350,000 units. This year also shows that Hyundai’s overseas sales are higher than its domestic sales. The biggest jumped in sales are China (up 15%) and Czech (up 20%) and it is beefing up its capacity in China. It plans to open another plant in China soon so as to capitalize on China’s mammoth 19 million cars sold last year. It hoped to close the gap in sales with rivals GM and Volkswagen very soon. Hyundai’s sales in the U.S increased to 388,000 which represent an increase of 7.1% over last year. Later this year it’s Turkey plant will be upgraded to a 200,000 car per year capacity which doubles its current capacity. As for the year 2013 Hyundai forecast its global production capitalization at 102.4%. Below is the chart of Hyundai’s Global car plants by capacities.
Country
|
Capacity
|
Turkey
|
100000
|
Brazil
|
150000
|
Russia
|
200000
|
Czech
|
300000
|
USA
|
350000
|
India
|
600000
|
China
|
1000000
|
Total
|
2700000
|
Hyundai’s African sales is also picking up very strongly. It’s market share of 12% is closing in very fast on Toyota 14.2% market share and its sales are growing at about 50% rate each month. Algeria, Angola, Morocco, Egypt and South Africa accounted for 80% of its sales in Africa. Please be noted that Algeria, Morocco and Egypt and many countries in the Middle East are markets abandoned by Proton several years ago due to poor sales.
Localize the design and styling
In a recent survey it is found that quality and car design has been on the top of the lists of consumer wants. In other words consumers want their cars to be stylish and modern. Bob Lutz, Vice Chairman of General stated that the car industry has merged with the entertainment business. Design and styling as well as technology are important criteria for the marketability of any car. Chung realized that for Hyundai to re-enter the U.S market after its dismal failure earlier it needs to adapt to the ever changing consumer taste. As a result it invested in a $30 million Hyundai-Kia Design and Technology Centre in California. Its purpose is to design and make cars according to the current consumer trends in the U.S. One result is the Hyundai Santa Fe SUV which was design by the Hyundai-Kia design team and became the best seller in the U.S and around the globe. Another is the Sonata which has been redesigned from the original to suit the needs of the consumers in America also became a global best seller.
To sum it, Oh Sung Hwan the Deputy General Manager of production at Hyundai’s plant in Ulsan said “We built cars according to the consumer’s point of view not the engineers”. That means if we want to succeed in car manufacturing we need to produce cars that buyers wants and not your accountant, Designer or CEO wants.
Once bitten twice not shy
Not many company dared to re-enter a market that it failed to penetrate earlier without considering with all the negative stigmas associated with the company. As we have indicated earlier during its first attempt to penetrate the U.S market in 1986, it ended in a disaster. The quality was so bad that it was liken to the East Europeans outcasts like Yugos and Ladas and some even calling it ‘suicide boxes’. Chung knows that he has to overcome this bad quality image if Hyundai were to re-enter the U.S market. How does he do it?
Before going in again he had to convince the U.S car buyers that the new Hyundai’s are of much better quality than the earlier cousins. Chung began a bold move by offering a 10 year or 100,000 miles warranty so as to give the U.S consumers a peace of mind that they are indeed buying a quality product. This is because people will reckon that no inferior quality manufacturer will offer a 10 year or 100,000 mile warranty. In a way it was a psychology game and Hyundai won. According to Hyundai Motor America’s president Finbarr O’Neill, “The warranty allows us to get on people’s shopping list and we moved from brand of last resort to brand of choice.”
Short Design to Market
Chung knows that its competitors are always keeping a close distance with Hyundai and never let it swayed far. He also knows that if he is to keep them at a distance he has to constantly move Hyundai forward and making it a hard act to follow. One way is to speed up the design to product cycle which not only helped Hyundai to cut down its cost but also in recovering the associated cost of investing in new engines and models.
For example in 2002 Hyundai set a benchmark for design to production at 40 months. However the benchmark kept dropping as the years went by and by the end of 2012 it had went down to 28 months. Hence by constantly keeping the benchmark down it made sure that its competitors are kept at bay.
Global car demand shifting to Asia
While car sales are dropping in matured markets like in the U.S, Europe and Japan, there has been a marked increase of car sales in Asia. Sales in Asia are growing especially in China and India for the past few years. In 2012, China’s total new car sales totalled 19.3 million units while India’s sales totalled 2.63 million units even though its sales suffered of late due to higher fuel prices and high interest rates. The following chart shows China’s vehicle market as from 2000 to 2012.

In China Hyundai is trying to beef up its sales there though its partner Beijing Hyundai Motor by increasing its dealer network from 802 to 860 by end of this year. Further efforts include the introduction of a D-segment model and also improving the customer service and brand image.
In summary
To summarise, you can see that Proton’s business model is exactly the opposite of the more superior Hyundai’s. Firstly, Proton’s domestic car sales has been trending down since 2004 as evident from the above the sales chart. In 2004, Proton recorded a sale of 163,242 units of car and in terms of market share it lost another of 3% compared to the previous year. Exports also suffered due to the intense competition by Japanese and Korean car manufacturers. Instead of being outward looking to expand its sales overseas it ended up looking inward so as to provide the sales to keep it going as a concern.
Secondly, Proton cars had always been designed to cater to the middle age or adult market. If you look around those folks that are driving Protons are mostly family man whereas those that are driving MYVI (Daihatsu rebadge) are mostly teenagers. Proton lacks the ‘Coolness factor’ in its car design. Design and style remains the top priorities on the lists of ‘must have’ in teenager’s choice of choosing a car. Korean products be it smartphone, smart TV, cars, fridges and washing machines always have the ‘coolness factor’ taken into consideration in their design. People want something that is modern, sleek and technologically advanced and not something dated or daddy’s products.
Thirdly, Hyundai is able to offer many choices from a small platform. Consumers like choices and Hyundai understands it. In its 2013’s line-up, Hyundai is offering 40 different models and 33 of those came from only 6 platforms. Being on so few platforms means cost savings from the shared common design, parts, engineering and production facilities. Having platforms in most major markets enables Hyundai to move its production around and as needed. Hence, flexibility of production platforms will be the main competitive factor in the future.
In view of the above factors, Proton is facing an uphill task that only gets tougher going forward. In the next few years, all the global car manufacturers will be facing tough competition from more than 40 Chinese car manufacturers like SAIC,Chery, Dongfeng, Beijing Automotive Group, BYD Automobile and Geely. Many of them are already in partnership with Western car manufacturers to design and manufacture cars.


