Inflation although is known to many but at the same time also the least understood. This is because it affects us stealthily and by the time you realise that inflation has hit, it is already too late. What is Inflation? Other than rising prices not many people know what causes it, how it is measured and most importantly affects our daily lives.
But why are we still hard pressed to meet ends need despite improving economic fundamentals such as higher economic growth rates, lower inflation, increasing GDP per capita, booming housing sector, improving external sector and so on. Everything seems so rosy and yet our standard of living is not reflecting it. Why is happening?
Thanks to our government’s propaganda machinery, we are made to believe that everything is in good hands. By doing so, it ensures that they will be re-elected in the next election. In our daily life, we are faced with basic economic problems like compromising choices between our ‘needs and wants’. Thus, certain basic necessities are needed in order to survive such as food, lodging, transport and etc. Due to our limited resources (income), we have to carefully allocate it so as to maximize our final objective. Unfortunately, however well we plan, we realized it is increasingly difficult to meet our budgets. Why is this so? The main reason is inflation.
Who is responsible for Inflation?
Who is responsible for all the inflation in the economy? The answer is our Government. There are three ways our Government inflates the economy.
- By printing more money or Quantitative Easing as it is known without any backing of real money like gold. It is merely turning on the Printing Press and print or in other words COUNTERFEITING. To illustrate how would an increased in the money supply causes inflation, we shall use the following example.
Say if I am able to print or counterfeit money (Quantitative Easing) and decided to spend say $50,000. To avoid the risk of being discovered using counterfeit money, I decided to spend it in a small town known as Kampong Simee. So I start buying some real goods like furniture, rice, cooking oil and handicrafts with my counterfeit dollars. Everybody seems to be happy because I am giving them extra businesses. Soon, I will have to leave town with $50,000 worth of goods while my counterfeit money being shared by the town folks. The question is who will lose as a result from my gain?
The answer is all the folks in Kampong Simee as I am leaving the with less goods than they had before. What they have is the extra $50,000 circulating in their community. This simply means that there is now more money to bid for the fewer goods that are available in the town. This will ultimately cause an increase in the price of goods as the general price level is determined by dividing the total money supply by the amount of goods. Hence since the money supply has increased by $50,000 while the amount of physical goods has decreased then it will result in higher prices. This can be summarized by the following formula.
MV = PT, or P = MV/T where
M = Money Supply
V = Velocity of Money
P = Price
T = Transaction or Goods available
On the contrary what happen when I withdrew $50,000 from the town? There will be less money circulating and thus everyone in town benefits. This is because there are now more goods to be shared among them with the smaller money supply in the community. Thus now you understand how the money supply influences the general price level. The bigger the money supply the higher will be prices of goods and vice versa.
- The second method is through the Banks.
Since the banking sector operates on the basis of Fractional Reserve Banking and by increasing the amount of funds the bank can lend out, it greatly help increase the Money Supply in the economy. Banks are required to reserve a certain percentage (normally 3-10%) of their deposits in order to remain solvent, maintain investor confidence and also act as an insurance against a ‘bank run’. This reserve is known as the Statutory Reserve Requirement (SRR) and Central Banks can either increase or reduce this percentage so as to manage the Money Supply in the economy. An increase in the ratio means Central Banks are moping up excess liquidity and is aiming for a ‘tight money’ regime in the economy and vice versa.
Say for example in a environment where the SRR is 10%. A bank receives a $100 deposit can lend out $90 after deducting $10 for the SRR. What happens next is that the borrower of the $90 writes a cheque to somebody who will later deposit it back into the bank. When the bank receives the $90, it can then lend out 90% of it which is $81 and this process will go on until finally it will reach $1000 or ($100+$90+$81+….. = $1000). By the time it reaches $1000, the bank had already made more than 40 different loans from the original $100. So the leverage in this case is 1 to 10 ($100 to $1000) as can be shown partly by the table below.
Number
|
Amount
|
Less 10%
|
1
|
100
|
90
|
2
|
90
|
81
|
3
|
81
|
72.9
|
4
|
72.9
|
65.61
|
5
|
65.61
|
59.04
|
6
|
59.04
|
53.14
|
7
|
53.14
|
47.83
|
8
|
47.83
|
43.04
|
9
|
43.04
|
38.74
|
10
|
38.74
|
34.87
|
What will happen if the SRR is reduced to 5%?
Again the bank when receive $100 will lend out $95 and the $95 will again make its way back to the bank and the process will go on until it reach $2000. The process can be shown in the table below.
Number
|
Amount
|
less 5%
|
1
|
100
|
95
|
2
|
80
|
90.25
|
3
|
64
|
85.73
|
4
|
51.2
|
81.45
|
5
|
40.96
|
77.37
|
6
|
32.76
|
73.5
|
7
|
26.21
|
69.82
|
8
|
20.97
|
66.33
|
9
|
16.77
|
63
|
10
|
13.42
|
59.86
|
By the time it reaches $2000, the bank had already made more than 100 different loans from the original $100. So the leverage in this case is 1 to 20 ($100 to $2000). The total leverage can be obtained simply by dividing 100 by the SRR. If the SRR is 2% , the leverage should be 50 times (100/2). So in conclusion, by reducing the SRR from 10% to 5%, central banks will be able to increase the Money Supply in the economy by 100%.
- The third method is through Central Bank’s Open Market Operations of securities such as Bonds and Bills. When the Central Bank made a purchase of bonds, also known as ‘open market purchase’ it will increase the money supply in the economy. How it works? When the Central Bank purchases a $100 bond from a commercial bank then it will need to issue a cheque for the purchase. The commercial bank in return will either have to deposit it into its account with the Central Bank or cash in for currency which will be stored in its vault. The Central Bank ended up with $100 more in bonds and less $100 in reserve while the commercial bank have extra $100 in reserves and less $100 in bonds. Hence this will raise the Money Supply in the economy by $100.
An ‘open market sale’ of bonds will have a reverse effect and it will cause a contraction of $100 in the Money Supply. Such operation of buying and selling of securities by the Central Bank is similar to the job of a floodgate controller in a dam. By releasing or closing the gates, it can then manage the level of water in the dam.
Coming back to our main point on why are we worse off despite increased disposable income. I present to you another hypothetical case study with the following assumptions.
- An individual named Sam with an income of $1000
- No other source of income
- He has a basic set of needs and wants
The following tables show his basic needs and wants.
Table 1 - Needs
No.
|
Description
|
($)
|
1
|
Food
|
150
|
2
|
Housing
|
200
|
3
|
Clothing
|
80
|
4
|
Education
|
100
|
5
|
Transportation
|
130
|
6
|
Medical
|
70
|
7
|
Entertainment
|
90
|
8
|
Insurance
|
100
|
9
|
Savings
|
80
|
TOTAL $
|
1000
|
Table 2 - Wants (Gratification)
No.
|
Description
|
($)
|
1
|
Super Bike
|
150
|
2
|
Swimming Pool
|
100
|
3
|
A new MPV
|
120
|
4
|
A bigger House
|
180
|
5
|
A dream holiday
|
100
|
Table 1 consists of the basic needs that must be satisfied to continue living. His family need food to survive, clothing, education for children, transport to work, a house to live in and etc. After deducting the basic needs, Sam is left with $80 for savings.
Apart from the needs, Sam also has a list of wants shown in Table 2. Those include a super bike, swimming pool, a new MPV and etc. Due to budget constraint Sam cannot afford either of the wants. He can if he is willing to cut back on some of the necessities or if he has a pay rise.
What happens if he had a pay rise?
Due to our Government’s pump priming, it has inflationary effect on the economy which caused an ‘appearance of a boom in the economy’. Bosses will think that with orders coming in, the economy is heading for a new plateau. So they decided to increase output and hence hire more workers. Hiring more workers away from competitors also resulted in a pay rise due to the extra demand. Thus, Sam got a pay increment of $100 as a result raise his disposable income to $1100. Overjoyed by the pay rise, he went to purchase a Pool with a monthly instalment of $100.
Unknown to him, the wage rise caused a price-wage inflation which resulted from the increased money supply. Unable to foresee the effects of inflation, Sam soon realized it will cost him more than $100 to maintain his present lifestyle. In other words his pay rise had been completely absorbed by inflation. He has to pay more for his basic needs. The table below shows his new inflation adjusted cost of living.
Table 3 – Inflation adjusted Cost of living
No.
|
Description
|
Old ($)
|
New ($)
|
1
|
Food
|
150
|
165
|
2
|
Housing
|
200
|
220
|
3
|
Clothing
|
80
|
90
|
4
|
Education
|
100
|
120
|
5
|
Transportation
|
130
|
150
|
6
|
Medical
|
70
|
100
|
7
|
Entertainment
|
90
|
100
|
8
|
Insurance
|
100
|
120
|
9
|
Swimming Pool
|
100
|
100
|
10
|
Savings
|
80
|
35
|
Total ($)
|
1100
|
1200
|
From the above table, it shows that his monthly budget has ballooned to $1200. How is he going to account for the difference? The following are the two solutions available to him.
- Eliminate one of the items
- Reduce expenditure on some of the items
Say if he decided to choose option 2 then his lifestyle will look like the following.
Table 4 – Adjusted lifestyle with pool
No.
|
Description
|
Old ($)
|
New ($)
|
1
|
Food
|
165
|
150
|
2
|
Housing
|
220
|
220
|
3
|
Clothing
|
90
|
80
|
4
|
Education
|
120
|
120
|
5
|
Transportation
|
150
|
150
|
6
|
Medical
|
100
|
90
|
7
|
Entertainment
|
100
|
80
|
8
|
Insurance
|
120
|
100
|
9
|
Swimming Pool
|
100
|
100
|
10
|
Savings
|
35
|
10
|
Total ($)
|
1200
|
1100
|
As seen from above in order to maintain his standard of living he has to cut down his expenses on food, clothing, medical expenses, entertainment and insurance.
Hence, what can be concluded from the above is that although he had more things now than before (including the pool) the monetary distribution of his spending had been altered. Had he knew the effects of inflation then most probably he wouldn’t have bought the swimming pool. He had a choice of getting rid of the pool so as to maintain his former lifestyle but he didn’t. Now his life is less enjoyable because of the reduce budget on the needs that he enjoyed earlier. He thinks that he is better off because he was deceived into thinking he now have more things in life. In actuality he is worse off.
Thus, putting it into a larger context, our Government also did the same as our example above. It also involve in counterfeiting money but on a larger scale. Whenever our Government increases the money supply the people in the market place will have to pay higher prices. But a lot of people does not realise that inflation is very important to our Government. Why?
You see what will happen when our Government only raises the money supply once? The inflationary currency will make one complete cycle through the market and guess what? Prices will begin to stabilize at a new higher level. People will soon realize that their wage rise is going to be a onetime affair and they soon begin to cut back their expenses on entertainment, food, medical and so on. Businessman who earlier expanded their production will also cut back on their investments. Sooner or later it will cause a slowdown in the whole economy also known as a recession. Recession is a liquidation period after the inflationary or boom cycle.
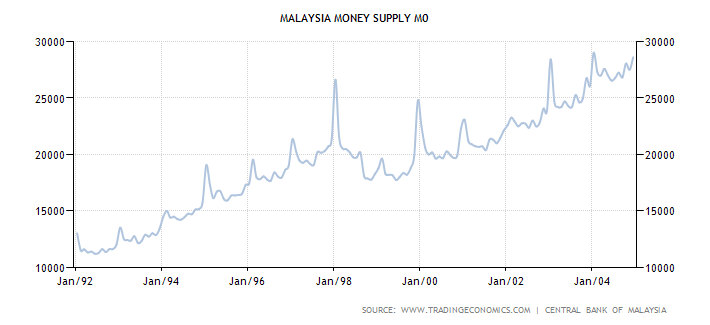
Government doesn’t like recession because it spells trouble for them. So the only way to prevent a recession is to reignite the inflation. Hence, there will be more money printing (counterfeiting), more bank loans, more consumer spending and higher prices. Again to support their present lifestyles consumers amass more debts through credit cards and personal loans. Inflation is also important in helping the Government to inflate various asset classes. Take for example the stock and real estate market. Both markets need liquidity and benefits from inflation, without it they will crash. As I have shown inflation is the result of an ever increasing money supply. Without the new money coming into the market through Quantitative Easing who is going to finance those margin accounts and housing loans? Thus with the ever increasing inflow of new money into the system stock and real estate prices will be bid up beyond their fundamental values. Stocks will be selling at 30 to 50 times their earnings and houses will be selling at more than 10 times the average yearly income. Hence, bubbles will be formed in all asset classes. What if the Government slows inflation by reducing the money supply? Stock and Real estate prices will fall because there isn’t enough money to support the price level. In fact this is already happening in Malaysia. Look at our Money Supply chart below.

Our Money Supply has slowed since early 2014 and if our Government does not do anything to address this problem we will be seeing lower stock and real estate prices soon. The only time that the Money Supply dropped more drastically is during the Asian Financial Crisis in 1998. Take a look at the Money Supply chart below. Our Money Supply peaked in the early months of 1998. I am sure everybody remembered the good old days of flipping houses and punting in the stock market then. Of course, it ends badly and many investors got burnt.
Thus it can be seen that all asset bubbles are a result of inflation and hence money supply. All bubbles will bust when inflation ends. That is why our Government will always have to inflate our economy.
The irony is that although our Government needed inflation to grow the economy but at the same time it does not want the public to know the true picture of the inflation. Hence, the second part of the article will address the ‘WHY’ and also how it managed to report low inflation figures.
The main objective of the second part of this article is to determine the following :-
- Whether the Consumer Price Index (CPI) is an accurate indicator of the cost of living in Malaysia;
- Whether the CPI can be relied upon to be the sole criteria upon which salary and Government obligation adjustments are based; and
Inflation/Consumer Price Index (CPI)
The most commonly used method to measure the rate of inflation apart from the GDP Deflator is the CPI or Consumer Price Index. The Consumer Price Index measures the movement of goods and services purchased for consumption over a period of time usually by monthly and yearly.
The Relevance of CPI
The following are some facts on the importance of the CPI:
- It is essentially an indicator of the effectiveness of the past policies implemented by our Government. It provides information on the movement of prices in the economy to the Government, Business and private citizens. It also helped provide a gauge on the ‘temperature’ of the economy. The information on the price movement of goods and services will help the authorities to implement its monetary policy targeting such as the inflation rate more effectively. If our economy is experiencing a high inflation rate then Bank Negara will counter it by implementing an appropriate ‘tight money policy’. The purpose of this policy is to reduce the overall money supply and hence economic activity. This will result in a slowdown in demand that will lead to a decrease in prices and hence will achieve price stability.
- The authorities tend to link the CPI to social security payments such as pension, citizenry welfare like disable and old age, subsidy food for students like fresh milk and free lunch, cost of living to wages adjustments and so on. Hence, as a result the CPI movement will influence the yearly budget set by our Government. Similarly, in the private sector, many corporations and companies also used the CPI as a basis for their wages and COLA adjustments.
- The Corporate sector often used the CPI as a market indexation tool in revising their wages. What is market indexation? To illustrate I shall use the LIBOR as an example. In the financial industry, the pricing of their interest rates are tied to the performance of the LIBOR or London Interbank Offer Rates. So, if the LIBOR is manipulated upwards then the interest rates charged on most financial products such as housing and car loans, personal and corporate loans will be higher. Thus, financial institutions will be able to charge more and hence increase their profits. The rate fixing of the LIBOR affects about $800 trillion of financial products globally. Similarly, the CPI was also used like the LIBOR as an indexation tool for many corporates in revising their yearly wages and allowances. Thus, if the CPI is manipulated downwards then it will benefit the corporations because they can revise their salary and allowances with a smaller rise.
Limitations of CPI
The livelihood of millions of Malaysians is affected by the CPI. The CPI is used as a bargaining tool for the employees and unions to fight for higher wages. However, the question that needs consideration is whether the CPI presented to us by our Government is being calculated in a fair and accurate manner that truly relects the cost of living?
I shall, in this paper consider whether our CPI really does reflect our current lifestyle and thus cost of living.
To begin with, we will look into the process on how the CPI is calculated. This is important because the classification, grouping and weightage all play an important role in determining the rate of the CPI.
How to Calculate the CPI?
How is the CPI measured? Certain essential goods and services are classified ‘into a basket’ that will represent the majority of the products consumed and services used. In Malaysia, they are classified into 12 Groupings that range from Clothing to Health Care. Each Group is also given a separate weightage, meaning each Group is assigned a figure depending on what impotance the government has given the same. The higher the weightage given, the higher impotance is given to that particular group.
Below are the 12 Main Groupings of our Consumer Price Index.
Table 1: CONSUMER PRICE INDEX FOR MAIN GROUPS, MALAYSIA (2010=100)
Group
|
Wt.
|
Index
|
% Change
| |||
Jan
2011 |
Dec
2011 |
Jan
2012 |
Jan 2012 /
Dec 2011 |
Jan 2012 /
Jan 2011 | ||
TOTAL
|
100.0
|
101.8
|
104.2
|
104.5
|
0.3
|
2.7
|
Food & Non-Alcoholic Beverages
|
30.3
|
102.6
|
106.6
|
107.5
|
0.8
|
4.8
|
Alcoholic Beverages & Tobacco
|
2.2
|
104.6
|
104.6
|
104.6
|
0.0
|
0.0
|
Clothing and Footwear
|
3.4
|
99.9
|
99.6
|
99.4
|
-0.2
|
-0.5
|
Housing, Water, Electricity, Gas & Other Fuels
|
22.6
|
100.8
|
102.5
|
102.6
|
0.1
|
1.8
|
Furnishings, Household Equip. & Routine Household Maintenance
|
4.1
|
101.0
|
102.5
|
102.9
|
0.4
|
1.9
|
Health
|
1.3
|
101.5
|
103.6
|
103.9
|
0.3
|
2.4
|
Transport
|
14.9
|
103.2
|
104.9
|
104.9
|
0.0
|
1.6
|
Communication
|
5.7
|
100.0
|
99.4
|
99.4
|
0.0
|
-0.6
|
Recreation Services & Culture
|
4.6
|
99.7
|
103.1
|
103.2
|
0.1
|
3.5
|
Education
|
1.4
|
101.0
|
103.2
|
104.1
|
0.9
|
3.1
|
Restaurants and Hotels
|
3.2
|
103.2
|
107.5
|
107.8
|
0.3
|
4.5
|
Miscellaneous Goods & Services
|
6.3
|
101.1
|
103.9
|
103.8
|
-0.1
|
2.7
|
Non-Food
|
69.7
|
101.5
|
103.2
|
103.2
|
0.0
|
1.7
|
Durable Goods
|
6.5
|
100.2
|
101.2
|
100.8
|
-0.4
|
0.6
|
Semi-Durable Goods
|
4.4
|
100.2
|
100.3
|
100.2
|
-0.1
|
0.0
|
Non-Durable Goods
|
41.6
|
102.9
|
105.5
|
106.1
|
0.6
|
3.1
|
Services
|
47.5
|
101.2
|
103.8
|
104.1
|
0.3
|
2.9
|
Or can be shown graphically with the following Pie Chart.
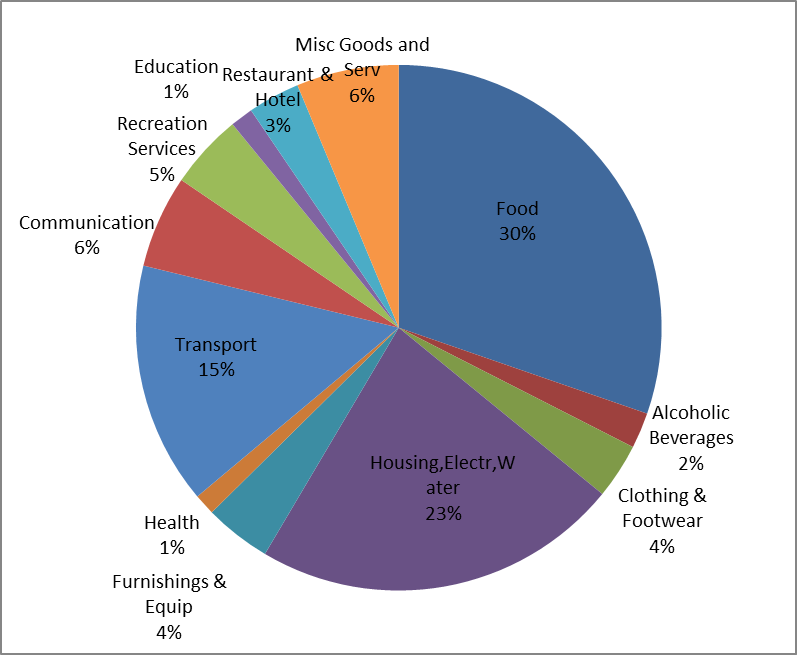
From above, we know that from Jan 2011 to Jan 2012 the price of goods and services increased by 2.7 %. This result is obtained by aggregation the readings from the 12 Groupings.
Our next concern is to determine the accuracy of the figures. After a study of the figures for the last few years it is apparent that there are some issues and inconsistencies in the figures. It is apparent that there are flaws in our CPI.
What are the flaws in our CPI?
As a start, a comparison of the CPI table between Malaysia and the United States is done. The reason why the U.S table is used for comparison is mainly because our CPI classification is similar to the US. The Groups that contributed to the discrepancy in our CPI calculation is highlighted in red.
No.
|
Group & Weighting
|
Malaysia
|
USA
|
Remarks
|
1
|
Food & Non-Alcoholic
|
30.3
|
14.312
|
Over Represented
|
2
|
Alcoholic Beverage
|
2.2
|
0.949
| |
3
|
Clothing & Footwear
|
3.4
|
3.564
| |
4
|
Housing,Water,Elec,Gas & Other
|
22.6
|
36.239
|
Under Represented
|
5
|
Furnishings, House Equip and Maint.
|
4.1
|
4.04
| |
6
|
Health
|
1.3
|
7.163
|
Under Represented
|
7
|
Transport
|
14.9
|
16.846
|
Under Represented
|
8
|
Communication
|
5.7
|
3.499
| |
9
|
Recreation Services & Culture
|
4.6
|
5.99
| |
10
|
Education
|
1.4
|
3.281
|
Under Represented
|
11
|
Restaurants and Hotels
|
3.2
|
0.741
| |
12
|
Miscellaneous Goods and Services
|
6.3
|
3.376
| |
Total Weightage
|
100
|
100
|
Source:
http://www.statistics.gov.my/portal/download_Prices/files/CPI/2012/JAN/BI/02Malaysia.pdf and http://www.bls.gov/cpi/cpid1309.pdf
From the table above, the 5 Groups that caused much discrepancy in our CPI calculation is highlighted in red. The problem is either over or under-representation in their respective weightings as compared to the BLS (Bureau of Labour Statistics). Below is an analysis on each of the five Groups starting with the Food Grouping.
- Food accounted for too much weighting in the CPI
Based on the above Table, the Food and Non Alcoholic grouping accounted for 30.3% of the total CPI weighting. This can be quite considerable when we compare it with the rest of the world. The following chart is the for the food component as a percentage of the CPI for 25 countries around the world.

Source: http://www.oecd.org/
As can be seen from the chart above when you remove the countries at the top and bottom end of the spectrum (India and U.S) the statistical bias will be reduced. This would provide a fairer and more accurate picture of the weightage given to the food component for 23 countries. After the adjustment, the mean for Food Component of CPI in the 23 countries averages about 17.3%. Malaysia’s 30.3% food weighting in the CPI can be considered on the high end of the table after China’s 31.4%.
Because a higher than average weightage is given to the food component (30.3%), less emphasis is given to other components in the basket that deserve a higher weightage such as health (1.32%) and education (1.41%). Although expenses for health and education makes up a large portion a family’s budget, it is given an insignificant weightage. Clearly, this shows that the CPI in Malaysia is flawed.
The next question that arieses is how the 30.3% food weighting actually affects the calculation of the CPI?
Price Change
|
Weightage
|
in %
| |
Items
|
Sep 12-Sep13
|
Malaysia
|
USA
|
01 - Food & Non-Alcoholic Beverages
|
2.6
|
30.3
|
14.312
|
001 - Food Away From Home
|
3.9
|
10.04
|
5.713
|
011 - Rice, Bread and Cereal
|
2
|
4.39
|
1.231
|
012 – Meat
|
7.2
|
2.94
|
1.189
|
013 - Fish and Seafood
|
5.5
|
4.5
|
0.652
|
014 - Milk and Eggs
|
5.6
|
1.77
|
0.905
|
015 - Oil and Fats
|
-0.5
|
0.58
|
0.263
|
016 – Fruits
|
3
|
1.2
|
0.526
|
017 – Vegetables
|
4.9
|
2.14
|
0.461
|
018 - Sugar, Jam and Honey
|
5.2
|
0.59
|
0.299
|
019 - Food Products – Spices
|
1.4
|
0.81
|
2.13
|
010 - Coffee,Tea and Cocao
|
1
|
1.37
|
0.943
|
Total (%)
|
30.33
|
14.312
|
Source:
The above Table is the breakdown of individual items that comprise the Food and Non-Alcohol Beverages Grouping. Looking at the table above, there are a couple of issues that need to be addressed.
Firstly, why is this group given such a large weighting and accounted for 30.3%?
I am of the opinion that the weightage given is way too high. As our country gets more developed, the service sector is overtaking the manufacturing sector as the main economic driver. This is clearly reflected in the statistics for other developed countries as shown by the graph above. On average, food only takes up about 17.3% of the total weightage.
Secondly, according to FAO (Food and Agriculture Organization) of the United Nations, prices of basic food necessities around the world have increased by 33% between 2009 to 2013.This translates to about an increase of 8% per annum. During this corresponding period our CPI only went up about 11 index points (from 98 points in 2009 to 109 points in 2013) as can be seen below. This would translate to an increase of 2.75%.
This clearly shows that there is a glaring discrepancy in the increase of food prices in Malaysia compared to the world statistics. This being the case, our figures in Malaysia for food increases would always be lagging compared to world statistics. With such great emphasis placed on the food component (30.3%), our CPI increases over the years is also compromised and does not show the real increase that has happened.
See Charts below.
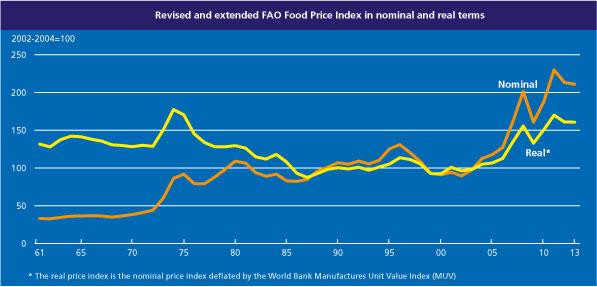
Source:Food and Agriculture Organization (FAO)-
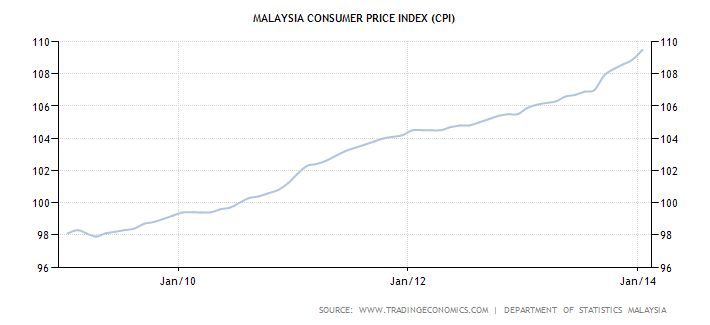
In 2009, our CPI reading was only 98 index points but then it shot up to 109.98 at the end of 2013. To calculate the percentage change during this period, we apply the following.
Percentage change = (109-98)/98*100 = 11.22%
The small percentage change (11.22%) in our CPI does not reflect the changes in the rapidly rising food cost around the world.
Thirdly, it is apparent that food prices have increased drastically over the last few years.
- Bias weighting in Housing, Water, Electricity and Gas.
The second grouping that is in dispute is the Housing, Water, Electricity, Gas and other Fuels. The following table is the breakdown of the Grouping.
Price Change
|
Weightage
|
in %
| |
Items
|
Sep12-Sep13
|
Malaysia
|
USA
|
04 - Housing, Water, Electricity
|
1.8
|
22.59
|
41.021
|
041 - Actual Rental for Housing
|
2.2
|
17.24
|
31.681
|
043 - Maintenance and Repair
|
1.4
|
0.67
|
4.04
|
044 - Water Supply & Misc
|
0.9
|
1.34
|
1.201
|
045 - Electricity, Gas & Other
|
0
|
3.34
|
4.099
|
Total (%)
|
22.59
|
41.021
|
Source : http://www.statistics.gov.my/portal/download_Prices/files/CPI/2013/SEP/BI/02Malaysia.pdf and http://www.bls.gov/cpi/cpid1309.pdf
Before we look into the breakdown of this Grouping, it seems justifiable to assign a big weighting since it is also known as the ‘Energy Grouping’. However as you can see most of the weighting goes to ‘Rental for Housing’ which was allocated a lion share of 17.24% out of the 22.59% or 76%. There are a couple of issues that I like to point out.
Firstly, the ‘Actual Rental for Housing’ does not breakdown into owner occupy and rental of residence. From BLS this Grouping can be further break down into Owner Equivalent (25.182%) and Rental of residence (6.499%). From Owner Equivalent, we can determine the mortgage and other cost associated with maintaining a house. I believe the weightage on this sub-grouping does not fully reflect the current cost of owning and maintaining a home. This is because in recent times, real-estate prices has escalated dramatically especially in the Klang Valley, Penang and Johor.
Secondly, by putting less importance to Electricity and Gas and Other Fuels in the ‘Energy Grouping’. Thus any price increase by the Government in Fuel and Electricity ‘will only have minimal impact’ on the overall grouping and hence the calculation of the CPI figure. Even with the recent rise in electricity tariff by 15%, it will have minimal effect on the CPI because Electricity, Gas and other Fuel represent only 3.34% of our Consumer Price Index.
This is yet again another example of how the CPI artificially reflects the increase in the cost of living by not giving sufficient importance to relevant components.
- Health Group weighting is too low.
Health expenses only accounted for 1.3% in the weightage of the Malaysian CPI? The BLS in the United States, allocated a weightage of 7.163% to this Grouping which better reflects the current cost of medical care.
According to the Household Income Survey in 2012, the average Malaysian household earns about RM 5,000 per month. Based on this statistic the health expenses of an average Malaysian household of 4 persons is only RM 66 per month (1.32% x RM5,000). This it would seem to be an understatement.
Below is the table of the Health Grouping.
Items
|
Sep12-Sep13
|
Malaysia
|
USA
|
06 – Health
|
1.7
|
1.32
|
7.163
|
061 - Medical Products & Equip
|
1.6
|
0.83
|
1.714
|
062 - Out-Patient Service
|
2.6
|
0.31
|
3.01
|
063 - Hospital Serv/InPatient
|
0.6
|
0.18
|
2.439
|
0631 - Govt Hospital
|
0
| ||
0633 - Private Hospital
|
0.9
| ||
Total (%)
|
1.32
|
7.163
|
Source : http://www.statistics.gov.my/portal/download_Prices/files/CPI/2013/SEP/BI/02Malaysia.pdf and http://www.bls.gov/cpi/cpid1309.pdf
Another thing that is not mentioned in the above Grouping is the ‘Medical Insurance’ expenses. It is listed in the Miscellaneous Goods and Services Grouping as insurance connected to accidents and health (0.14%). This I believe is under-weighted because we spend much more on health than life insurance from our income. Under-weighting the Health Grouping is a serious flaw because health care is the ‘biggest and most consistent’ source of inflation over the years.
- Education – Flawed in weightings.
I believe that the Education Grouping is grossly under-weighted and does not truly reflect its true cost especially at the tertiary level. The following is the breakdown of the Education grouping.
Price Change
|
Weightage
|
in %
| |
Items
|
Sep12-Sep13
|
Malaysia
|
USA
|
10 - Education
|
2.6
|
1.41
|
3.281
|
101 - Pre Primary & Primary
|
2.4
|
0.61
|
0.782
|
102 - Secondary Education
|
2.4
|
0.38
|
0.389
|
103 - Post Secondary
|
7.4
|
0.12
|
0.375
|
104 - Tertiary Education
|
1.1
|
0.14
|
1.734
|
105 - Education n.e.c
|
1.7
|
0.16
| |
Total (%)
|
1.41
|
3.281
|
Source:
As can be seen from above, the weight given to the different sub groups are clearly flawed. Firstly, Education as the Main Group, accounts for only 1.41% of the total CPI weightage as compared to 3.281% in the U.S.
Secondly, the Pre-Primary and Primary education seems to be given higher weightage than Secondary, Post-Secondary and Tertiary education. Giving Pre-Primary and Primary higher weightage than the Secondary and Tertiary Sub-Group is not sound when it is common knowledge that Secondary and Tertiary Sub-Groups command a higher cost. In the U.S, tertiary education rightly commands the highest weightage which is 1.734%.
Our Tertiary Education Sub-Group should command the highest weightage as in the U.S because it cost the most. According to studymalaysia.com the average cost for a 3 year Business Degree in a private university cost between RM 45,000 to RM 80,000.
It is clear that insufficient weightage is given to Education component although it amounts to a substantial portion of a household’s expenses.
- Transport – Under Represented
The next grouping that we are going to examine is Transport. The following is the table for the Main and sub-grouping of Transport.
Price Change
|
Weightage
|
in %
| |
Items
|
Sep 12-Sep13
|
Malaysia
|
USA
|
07 - Transport
|
4.6
|
14.92
|
16.846
|
071 - Purchase of Vehicle
|
-0.1
|
2.9
|
5.551
|
0711 - Motocars
|
-0.1
|
2.55
|
5.033
|
0712 - Motorcycles
|
0.3
|
0.32
|
0.38
|
0713 - Bicycles
|
0.7
|
0.03
|
0.139
|
072 - Operation of Personal Tran.
|
5.8
|
11.8
|
10.105
|
0721 - Spare Parts
|
0.5
|
0.37
|
0.997
|
0722 - Fuels & Lubricants
|
6.6
|
8.77
|
7.959
|
0723 - Repairs & Mainte.
|
4.3
|
1.36
|
1.149
|
0724 - Other Services
|
-0.7
|
0.58
|
0.563
|
073 - Transport Services
|
3.8
|
0.94
|
1.189
|
0731 - By Railway
|
0
|
0.03
|
0.132
|
0732 - By Road
|
3.3
|
0.69
|
0.132
|
0733 -By Air
|
16.6
|
0.11
|
0.771
|
0732 - By Waterway
|
-8.8
|
0.07
|
0.151
|
0735 - Other Transport
|
4.2
|
0.04
|
0.003
|
Total (%)
|
14.92
|
16.846
|
Source:
http://www.statistics.gov.my/portal/download_Prices/files/CPI/2013/SEP/BI/02Malaysia.pdf and http://www.bls.gov/cpi/cpid1309.pdf
In transport under the sub-grouping of 071, the column for the purchase of motorcars (0711) is given a weighting of only 2.55. This is clearly under represented. In actuality, monthly payments for vehicle hire purchase constitute at least 10% of the average household disposable income.
To illustrate further, the low-end version of the Perodua Myvi which cost about RM44, 000 may be used. Assuming that the average annual household income at RM 60,000 per annum (RM 5,000 per month). For a loan of 90% (RM 39,144) with an extended repayment period of 9 years, consumers will have to spend about RM466 per month for the hire-purchase payments. Since the monthly loan repayment constitutes about 9.3% (466/5000) of the disposable income, assigning a weighting of only 2.55 is clearly flawed.
Wrapping Up
The CPI does not provide an accurate picture of the rate of inflation. I am of the opinion that our CPI is formatted in such a way that does not truly reflect the spending pattern of the lower income group.
Illustrations of this may be seen above.
Further, the Electricity and Gas Sub-Grouping under the Housing Main Group, accounted only for 3.34% of the weightage. Out of the 3.34%, 2.88% went to Electricity and 0.46% to Gas. From the data supplied by the Statistic Department as from Sept 2012 to Sept 2013 shows there is a 0% change in the index. This is yet again flawed.
I believe that if not for the manipulation of the CPI, our inflation rate would be much higher than the reported 2.7%. If classification of the groupings and weightings are done properly, then I believed the actual inflation rate could be much higher than the current rate. This would mean that the CPI increase would be higher year to year as opposed to what it is now.
Salary Adjustment
I have been made to understand that company salary adjustments and Government allocations to OKU and other forms of welfare are benchmarked to the CPI. It is also argued that such compensations should differ for different states in Malaysia due to their difference in their respective CPI.
Figure by States
State
|
Jan 2013
|
Jan 2014
|
Difference
|
Sarawak
|
105.1
|
108.9
|
3.6
|
Sabah
|
105.9
|
108.7
|
2.6
|
Peninsular
|
105.5
|
108.9
|
3.4
|
The above table clearly demolish the myth that Sabah and Sarawak has a higher cost of living compared to the rest of Peninsular Malaysia and there is great income inequality.
The CPI figure by States shows that the CPI index points in Sabah and Sarawak does not vary much from Peninsular Malaysia. This is because they are within the range of 108 index points. Moreover, Sabah recorded only a 2.6% rise in the CPI reading which is lower than Peninsular Malaysia.
A Fair Salary Adjustment and Allowance Allocation
Thus, to help raise the standard of living and to help employees to cope with the increasing cost of living, I believe that a fair and reasonable solution should also take into account the following factors apart from that discussed above :-
- The increasing and phenomenal profit earned by employers is a factor that needs to take into consideration. The good fortune in terms of higher profits of employers like banks should be shared among the employees. As announced recently, most banks are enjoying record profits as shown by the table below.
Column1
|
Column2
|
Column3
|
Bank
|
Period
|
Profit
|
Affin
|
Q3 FY2014
|
RM 628.9 m
|
Alliance
|
9M FY2014
|
RM 405.5 m
|
Ambank
|
Q3 FY2014
|
RM 423 m
|
CIMB
|
Q4 FY2013
|
RM 1.04 b
|
Hong Leong
|
1H FY2014
|
RM 1.06 b
|
Maybank
|
FY2013
|
RM 6.55 b
|
Public Bank
|
Q4 FY2013
|
RM 1.03 b
|
RHB
|
FY2013
|
RM 1.83 b
|
Source: various banks website and media
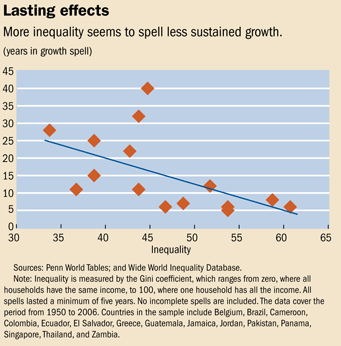
- By raising the wages of workers, it not only help eased their burden in coping with rising cost of living but also helps our Government to reduce the income inequality among its citizens. This is because only when income inequality is reduced then a country’s economic growth will be sustainable. A study by the IMF shows that the lower the income inequality the longer the number of years a country can enjoy sustainable growth. It can be shown by the following graph.
Malaysia can be considered one of the most unequal nations in the Asia Pacific region in terms of income distribution. Income inequality can be measured by a statistical approach called Gini coefficient or index. The Gini index is used to measure the gap between the poor and the rich. The higher the reading the higher is the inequality. The following graph shows Malaysia’s standing in the Asia Pacific region.
 .
.
As can be seen from above, Malaysia ranked third in terms of income inequality in Asia Pacific. High income inequality means higher proportion of the nation wealth held by a smaller group of individuals. This also implied that any benefits that derived from economic growth will flow to the higher income group instead of the lower income. To lessen the negative effects of income inequality on the provision of health care, education, housing and other social services, our Government increased the minimum wage to RM900 as of this year.
However this will not address the inequality problem as I will demonstrate with the following. According to the 2012 Household Income Survey, it found that the average monthly income of Malaysian households rose from RM4025 in 2009 to RM5000 in 2012. This is equivalent to an average rise of 7.2% per annum. A household by definition consists of 4 family members.
Thus, it can be deduced that the average income per person in a household is RM1250 (RM5000/4). So, in essence raising the minimum wage to RM900 does not have much material effect on average household income since they already earned more. On the other hand, it benefits the foreign workers who are earning a basic salary of about RM600 per month. To be effective, the minimum wage should be raised close to the average household income per person of RM1250.
Wrapping Up
In essence, one of the main objectives of lowering the reported inflation rate is to lower our Government’s obligated social expenditure such as OKU, Pension, Social welfare and so on since such expenditures are benchmarked against the inflation rate. Lower inflation means lower Government expenditure and hence lower budget deficit. As our government budget can be defined as (G – T) where G is the Government expenditure and T is the Taxes. Assuming Government Tax being constant, any reduction in Government expenditure means lower budget deficits.
Inflation is just one of the many economic indicators that are manipulated by Governments the world over. Others include the Bonds, Interest rates, Currency, Stock Market, Real Estate and so on. For your information even Government debts are a farce because most of their debts will not be repaid. They will continue paying the interest rates while keep rolling over the principle as the years passed. This is why bonds are also known as perpetual bonds and known to last generations. A good example will be Britain’s Perpetual War Bonds (which never matures) that dates back to the South Sea Bubble in 1720. The National War Bond is the most widely held Government Bond with more than 120,000 investors. The Debt Management Office estimated that more than £ 5.5 billion interest has been paid since their issuance.
In short, inflation is just one of the many headwinds hitting the Malaysian economy. Others that are more severe and requires quick action includes Budget Deficit, Currency devaluation, Household debts, Government debts, deteriorating external sector, corruption and the list goes on.
The author is the Economic Advisor to the National Union of Bank Employees