Saturday, December 28, 2013

Red Alert : Malaysians to brace for possible Indonesian Economic Meltdown

Indonesia is the fifth largest economy in Asia and the fourth most populous country in the world. Thanks to the strong macro-economic reform and liberalization of its international trade. As a result a strong economic growth to the tune of 6-8% is achievable for the past few years. Since the last Asian Financial Crisis, Indonesia has made much stride in poverty eradication, economic growth and human capital development. To stabilize prices, Monetary Policy tools such as interest rates, liquidity management and macro-prudential measures are used. Other measures taken to ensure sustainable economic growth includes raising minimum wage, reduction in fuel subsidies, electricity and other essential items, increase cash payment to low income group and broaden the tax base.

To broaden its tax base, Indonesia currently applies export taxes on palm oil and cocoa and selected minerals. Another measure taken is the reduction of the number of tax exempt items from the VAT list. Due to the past policy of increasing the number of items to be tax exempt from VAT, there is a considerable loss of revenue from this sector. Other measures to boost economic growth includes implementing a more transparent public procurement, export subsidy and import restriction, local content requirement and the promotion of FDI. This is in line with the Indonesian Government’s effort and objective to achieve the target of making Indonesia the fifth largest economy in the world.

Despite making some progress through the years, however the Indonesian economy has been experiencing diminishing returns in its economic growth. As of late the Indonesian economy has been experiencing a slowdown due to external factors such as slowing down of the global economy that is also affecting its major trading partners. Internal factors such as flip-flopping Public Policies, rise in corruption and policy failures in achieving its social objective such as the reduction in income disparity between the rich and poor, raising the wage level to compensate spiraling inflation and price stabilization.

In addition, recent large Government budget deficits has led it to implement protectionism policy such as requiring foreign investors to sell down their stakes in mining operations within a 10 year time frame and also the capping on foreign ownership in financial institutions also contributed to the recent economic rout. A good example is the collapsed of the recent takeover bid by Singapore’s DBS for Indonesia’s Danamon Bank. New rules are implemented recently such as delaying and complicating the process for foreign banks acquiring Indonesian bank up to 18 months. Foreign banks are only allowed to take up to 40% stake in any Indonesian banks in their initial bid. Thus, this is sending out mixed signals to foreign investors who are willing to invest into the Indonesian financial sector.  

Deteriorating Economy

As of late, the Indonesian economy has been exhibiting various negative developments in many of its economic indicators. Some of them include classic textbook symptoms of balance of payment crisis such as a depreciating currency, negative current account and high external debt. I present to you the summary of the Balance of Payment of the Indonesian economy as derived from Bank Indonesia.

Items
2008
2009
2010
2011
2012
2013
1. Current Account
126
10628
5144
1685
-24418
** -24276
2. Capital Account
-1832
4852
26620
13567
25161
**  13064
3. Net Errors & Omissions
-238
-2975
-1480
-3395
-528
**     -524
Overall Balance (in US$ Million)
-1945
12506
30285
11857
215
** -11737


Current Account to GDP (%)
0.02
1.95
0.7
0.2
-2.8
**   -3.6
Debt Service Ratio (%)
17.2
21.1
19.8
21.7
34.9
**   38.46


** Denote data until Sept 2013


Source : Bank Indonesia

Negative Current Account

As noted above, Indonesia’s Current Account in 2013 has run into negative territory since last year. This can be illustrated by the following graph.


As of September 2013, the average first 9 months of the Indonesian Current Account to GDP deficit is 3.6% or an increase of 28.5% from last year’s 2.8%. There are two reasons contributing to this.

First, the deficit has been contributed by the imbalances in the import over exports.  Indonesia as with other developing countries depended much of their export earnings on a small number of natural resources such as rubber, minerals, palm oil and etc. Depending too much on natural resources exports poses a risk to macro-economic problem because their prices are very volatile as compared to manufacturing goods. Any drastic shift in prices will affect a country’s real income and its current account. This is because a drop in export prices will cause a slump in the economy and hence a negative current account. Furthermore, a prolong softening of the export prices of commodities will make it impossible for any Government to rebalance its Current Account. It will have to wait till the export prices recovers at a later date.

Second, the Indonesian Current Account deficit is also partly contributed by the failure of the domestic savings to catch up with domestic investment. Another contributing factor is the increase in the Indonesian Government Budget Deficit. These two are related and is best illustrate with the following equation.

CA = (S – I) – (G – T)
Where,
CA = Current Account
S = Domestic Savings
I = Domestic Investment
G = Government Spending
T = Tax collected by Government

The first equation (S – I) represents the net Domestic Investment. The current Indonesian Domestic Savings (S) rate stands at 32 % while the Domestic Investment (I) surged to 36 %. Hence there is a gap between Savings and Investment and the difference had to be borrowed from foreign sources. Thus this helped contribute to the decreasing value of the Capital Account.  

The second equation (G – T) is the Government’s budget deficit. When Government spends more than it receives then it will caused a Budget Deficit and vice versa. The Indonesian Government Budget Deficit is due to many factors such as the depreciating Rupiah, rise in the cost of subsidies, lower tax collection and lower exports due to sluggish economic recovery. The increasing budget deficit is best illustrated by the following graph.


Due to the above factors, the Indonesian Government budget deficit is expected to reach 2.02% to GDP next year.

Depreciating Rupiah

The USD/IDR exchange has declined to new multi-year low or 5 years low and last traded at 12,261 today. The devaluation of the Rupiah has not been engineered deliberately but due to deteriorating economic conditions such as the Current Account deficit, outflow of foreign funds from the equity and debt markets. The Rupiah has depreciated about 20% since the beginning of this year. It is now trading at a multi-year low or 5 year low to be precise. It will soon be testing the five year low of 12,345 which was set in December 2008 as shown below.
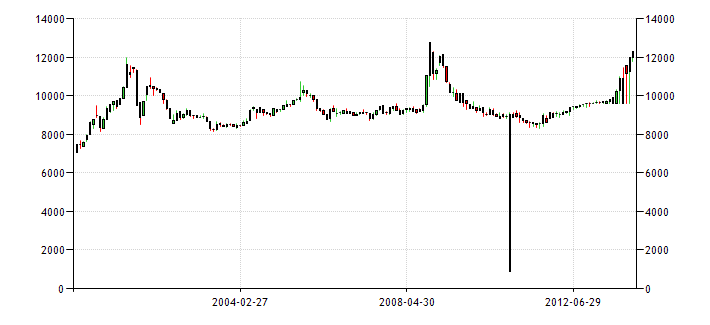


If the Rupiah continues to go down then there is a possibility it will break the 12,345 level. If it does, then there will be a risk of triggering another round of Currency Crisis in Asia.

Spiraling Inflation

Indonesia has been plagued by high inflation since the beginning of this year. The main culprit is the depreciation of the Rupiah by about 20% since the beginning of this year. The depreciation of the Rupiah contributed to the increased cost in subsidized fuel. Below is the inflation chart of Indonesia since 2010.  


Indonesia’s fuel import is on the rise since 2009. In 2009, fuel import only accounted for US$ 14.81 billion but has since risen to US$ 41.52 or almost 200%. The almost 20% depreciation of the Rupiah has really taken a toll on the prices of goods and services and hence the livelihood of the ordinary Indonesians. Below is the chart on the expenditure on Indonesia’s fuel import as from 2008.


Source : Bank Indonesia

Interest Rates

Capital flight from Asia has been heightened during the second half of 2013. Countries like India, Indonesia and Malaysia are particularly badly hit. To prevent further deterioration of the Rupiah, the Indonesian Government hiked its interest rate to 7.5% from 5.75% earlier this year. By increasing the interest rate the Indonesian Government hoped it will prevent further capital flight.

Hiking interest rates will have both cause and effect. The cause as already mentioned above but the effect will have long lasting effect on the economy. No country can withstand prolong interest rate hike. The increase cost on serving the loans from mortgage to margin accounts in the stock market will be felt. Needless to say such an increase will have a dampening effect on the economy, stock and property market.


External Debt

As noted above, the Gross Domestic Savings (32% to GDP) lagged Gross Domestic Investment (36% to GDP). To make up the difference, private firms had to borrow from external sources. Hence, this led to an explosion of the total external debt as shown below.
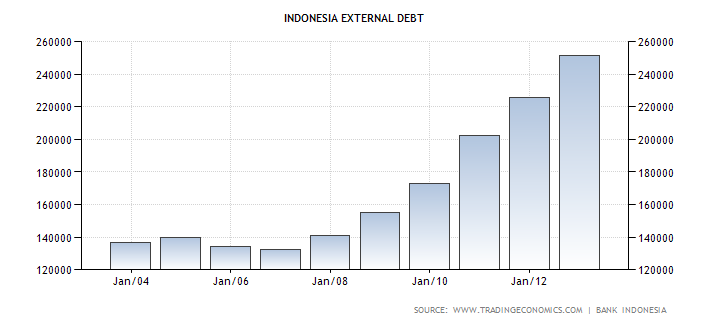


Total External Debt in Indonesia increased to US$ 254 billion in 2012 from US$ 224 billion in 2011. Although the External Debt to GDP is at 30%, low as compared to about 175% in 1998, but we must remember that this ratio will double if the USD/IDR halves. As for the record, the Rupiah has already depreciated by about 20% this year. To illustrate this point I will use the following example.

Malaysia as of 2012 with both the private and public sector owes a total an external debt of US$ 87.81 billion. At the prevailing USD/MYR exchange rate of 3.28 it is equivalent to RM 288 billion. What happens when the prevailing exchange rate halves next year?

Or the exchange rate of, USD 1 = RM 3.28 halved to USD 0.50 = RM 3.28

When the USD halved, RM 3.28 will only buy USD 0.50, then obviously we need to double our Ringgit amount in order to pay for the difference. Hence, instead of paying the original RM 288 billion our borrowers will now have to pay an additional RM 288 billion or RM 576 billion in totality.

Anyway the question on how high the External Debt/GDP is required to cause a major downturn in the economy is rather relative. We cannot draw a line to specify at what level the External Debt/GDP can be considered ominous. In1991, when India was hit by a major economic crisis its External Debt/GDP was only at 30%. In a similar vein when Indonesia was hit by the Asian Financial Crisis in 1998, its External Debt/GDP was at 175%.

Another point that needs to be taken into consideration is that most Asian Currencies except the Japanese Yen are classified as ‘MINOR’ Forex Currencies in the foreign exchange market. Minor currencies are thinly traded or illiquid unlike the ‘MAJOR’ Forex Currencies and hence manipulation is much easier. This explains why the Baht, Won, Ringgit and Rupiah fell precipitously during the last Asian financial crisis in 1998. Hence, in the event of a capital flight, a rapid depreciation of the Rupiah cannot be ruled out and this will also help destabilize the economies around the region when the Crisis becomes contagious.       

High Debt Service Ratio

As a result of its high external debt, Indonesia has been subjected to a very high Debt Service Ratio which is equivalent to about 40% of GDP. The table below shows Indonesia’s Debt Service Ratio as a percentage of GDP.

Year
Debt Service Ratio (%)
2008
           17.2%
2009
           21.1%
2010
           19.8%
2011
           21.7%
2012
           34.9%
       *2013
           38.4%
Source : Bank Indonesia. * denotes data till the 3rd Quarter of 2013.

As indicated above, Indonesia’s Debt Servicing Ratio/GDP has reached 38.4% in the third quarter of 2013, which is clearly unsustainable. The current depreciation of the Rupiah also meant that more Rupiah will be needed to repay Indonesia’s rising external debt. With the current downward trajectory of the Rupiah, I am not surprise that the Debt Service Ratio will balloon to at least 45% in 2014.

Wrapping Up

Despite having one of the lowest Government Debt/GDP at 24%, Indonesia’s economy is far from out of the woods. In fact its problems are just beginning and I expect the Indonesian economy to further deteriorate in 2014. The Rupiah risk much further devaluation and with Indonesia’s tiny foreign reserves which stands at only US$ 95 billion. The total foreign exchange reserves account for only 10.8% of GDP (US$ 878 billion). From this, I can conclude that the Rupiah will have problem to withstanding another round of capital flight or speculative currency attack.


Aggregating all the negative economic indicators, I reckon there is a good chance in 2014, the Indonesian economy might be heading for a perfect storm. What is feared is that the Crisis might spread to other countries in the region that are vulnerable especially India, Malaysia, Thailand, Philippines and others whose economies also displayed imbalances in both the internal and external sectors.   

What about Malaysia?

Malaysia is not in a better position either. We too have our own problems like high budget deficits, Government Debt/GDP, Household debts and so on. With the current IMF style austerity measure implemented by our Government, it will definitely have a dampening effect on our economy next year. Implementing contractionary Fiscal and Monetary Policy to straighten our Budget Deficit will not work without any corresponding measures to lighten the burden of the lower and middle income group. Cash handout through the BR1M scheme can be likened to Developed nations giving financial aid to Developing countries. In the end it will create a culture on dependency among the receiving nations.

Facing rising prices in multiple items next year, Malaysian consumers will have a tough time adjusting their budgets. Being rational consumers, they are going to be much more cautious in their spending habits. Hence there will be a tendency to spend less and save more for tomorrow. If this were to go on much longer, there is a risk of our economy being inflicted by the ‘Paradox of Thrift’ disease. Paradox of thrift is a situation where everyone saves more and spends less during times of economic uncertainty. Eventually total consumption will fall and will push the economy further into recession. Thus, increases in savings will do more harm than good to the economy.

On another front, our Ringgit which closes 3.287 to the Dollar today, has been quietly hitting multi year lows as well. Below is the USD/MYR chart.
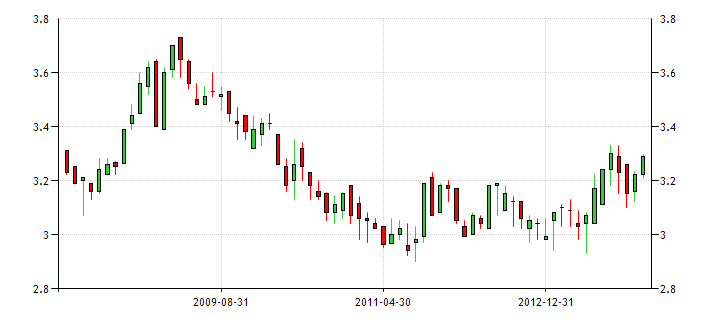

The depreciation of the Ringgit is not good for us as it will make our imports more expensive. Some industries like the semiconductor will be badly hit as many of their components are imported. Imported food and fuel prices will also rise in tandem and collectively will push up the prices of most other things as well due to the passed on inflationary effect.  

The problem with our Government and the Indonesian Government as well is that they have been lying on economic numbers such as the inflation and growth rates. This is because all the economic data published are nominal figures meaning it includes the inflation rate. To obtain the real rate of say our household income, we need to divide the figure with the CPI index figure. Recently our Government announced that our average Household income has reached RM 5000 per month or RM 60,000 per year. But this is just the nominal average Household income. To obtain the real Household income we need to divide it with the CPI index figure of 2013 which is estimated to be 107.5.
Hence the following is our real average Household.

Real average Household Income equals,
(RM 60,000/107.5) x 100 = RM 55,813 or RM 4650 per month

Similarly, we can apply the formula to calculate the real figure of all other economic indicators like GDP, GNP and so on.

The recent rise in the Malaysian Stock Market to record highs was used as a smokescreen to divert attention from our economic problems. It is use to fool the people into believing that our economy is growing healthily. However, one of the economic indicators our Government cannot manipulate is the exchange rate. This is because the foreign exchange market is transparent and too big to be manipulated because it trades about US$ 5 trillion a day.
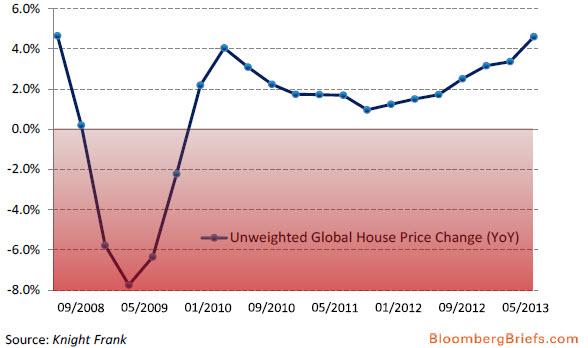
Moreover our economic problems will be further magnified with the coming tapering by the FED which will affect the total Aggregate Demand for Asian exports around the world. Another side effect of the FED tapering will be the rise of interest rates meaning there will be more outflow of capital from emerging markets. Thus this will put more downward pressure on emerging market currencies especially the Ringgit, Rupiah and Rupee. At the same time our local interest rates will be subjected to upward pressure. Hence, this might provide the trigger that will bust our Malaysian and the Indonesian Real Estate market which has reached bubble levels. The following are the charts for the Global real estate prices and by country.

Record High for Global Index

The above chart shows the Global House Price Index. Prices rose at an annual rate of 4.6 % in 2013 as compared to 1.7 % in the same period in 2012. The Knight Frank index incorporates house prices in 53 countries.


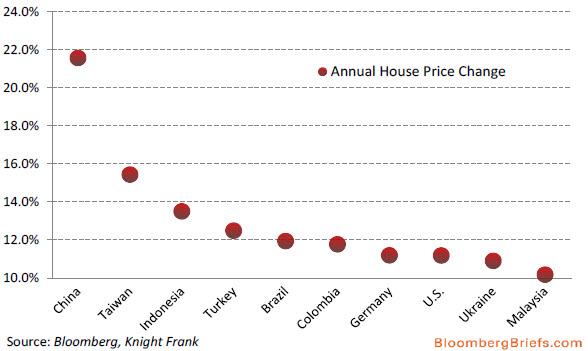
The second chart above shows the annual house price change and China leads with a 21% price rise. Out of the top 10, four are from Asia including Malaysia growing at more than 10%, while our neighbour Indonesia topping 13%. To conclude, despite authorities claimed that our real estate market is still very healthy; the above chart tells a different story.

Sunday, December 15, 2013

Record High for Global House Price Index - Malaysia in Focus


Record High for Global Index
The above chart shows the Global House Price Index. Prices rose at an annual rate of  4.6 % with 1.7 % in the same period in 2012. The Knight Frank index incorporates house prices in 53 countries.


The above chart shows the annual house price change and China leads with a 21% price rise. Out of the top 10 four are from Asia including Malaysia with average growth at more than 10%.

Chinese String of Pearls Strategy Complement its Global Economic Domination


Modernising the military is one of China’s four pillars in its modernisation drive which includes education, industry and infrastructure, military and agriculture. China’s largest strategic concern – regime survival and domestic stability - directly links to its economy. To sustain its economic growth China has to be depending increasingly on its external supply of energy, raw materials and food. So the development of Sea Line of Communication or (SLOCs) is vitally important as more than 80% of China’s trade go through the sea. The majority of the energy comes from the country’s coal about 65 %, 30% by oil and remaining by gas, nuclear and hydroelectric power.

China used to be the largest oil exporter in East Asia but in 1993 it became a net importer and in 2004, overtook Japan to become the world’s second largest importer. By 2020 an estimated 60% of the country’s oil has to be imported compared to 8% in 1995. Also to be noted is that over 65% of China’s oil import came from the Middle East and Africa. The chokepoint of Straits of Malacca is considered too risky for China because if there will be a collision near its narrowest point in Singapore it will disrupt the traffic flow by up to 2 weeks to china. So if there is a disruption of deliveries then China’s economy will be in a total standstill. So China knows the importance of protecting its SLOCs so that the oil supply from the Middle East remains uninterrupted.


Free Rider


Currently such protection is provided by the United States Navy in the form of permanent deployment of an aircraft carrier in the Gulf region. China currently enjoys being a ‘free rider’ meaning China gets free protection from the U.S Navy without having to pay for it. However, for the past few years the U.S has already been cutting back its defence budget plus more oil has since been discovered recently, hence making the U.S less dependent on Middle Eastern oil in the future.  Sooner or later the U.S will have to scale back its commitment to provide security to the shipping lanes in the Middle East. Hence, by then China will then need to commit more resources towards maintaining security of the shipping lanes in the Middle East. Below is the map of China’s SLOC and the oil shipping lanes from Hainan Island China till the Middle East.


Source : Stratfor


Picture courtesy of FAS (Federation Of American Scientist)
Shows the Hainan Island Naval base with Jin Class SSBN and Cave Entrance
Click to enlarge

String of Pearls Strategy


This gave rise to the String of Pearls strategy. It is like pearls tied to a string and each pearl represents a country normally a port where China can get access to it. The string that attach to the pearls represents the Sea Lines of Communication (SLOCs). The String of Pearls will provide China with forward presence and military bases along the SLOCs from China to the Persian Gulf in the Middle East. A pearl normally comes with facilities like airstrips and naval bases.


The First Pearl is located at the Hainan Island in South China. The Chinese have already upgraded the naval base and military facilities. This massive underground submarine and warship base is built because of its strategic location in the South China Sea. The entrance is so huge that it can allow the fleet of 50 plus conventional and nuclear submarines to go in and out without Western spy satellites detecting.


The Second Pearl is the port of Hambantota in Sri Lanka despite much objection from India. However the project is already under way and China is underwriting a US$1.2 billion package for the facility. China investment in this area will increase significantly as it has some interest in oil drilling in Northeast Sri Lanka. Hambantota port will also include aviation fuel storage facility, LNG refinery and a bunkering facility to refuel ships.


The
Third Pearl is located at the Chittagong port in Bangladesh. Fourth is the Woody Island located 300 miles east of the Paracel Archipelago. An airstrip has been upgraded for this purpose. And so does Port of Sittwe in Myanmar,  Marao in the Maldives and Port of Gwadar in Pakistan. The Gwadar port comes with a naval base and it is is chosen because of its strategic value in the 240 km distance from the Straits of Hormuz.  

In its Grand Strategy that encompassed the ‘Peace Development’, China has identified 3 stages in development spanning 50 years. This involves both the economic and military. In the first stage of development from 2000-2010 China hopes to double its GDP and upgrade its Navy from ‘Green Water’ to ‘Blue Water’ and operate within the First Island Chain that stretch from Japan to Philippines , has been achieved . The second stage from 2010-2020  with total GDP to be double and the development of the ‘Aircraft Carrier’  fleet of up to six carriers groups, to operate beyond the First Island Chain to reach the Second Island Chain which  stretch from Guam to Indonesia and Australia is already on target with the recent commissioning of its first Aircraft Carrier, The Liaoning. And finally, from 2020-2050 to catapult the nation to the middle rung of the Advanced Nations and with its Navy upgraded to a truly ‘World class Blue Water’ which can project power forward in all Oceans of the World. With a doctrine change from a inward looking to a outlook one, China’s Foreign policy has to be a more outward looking with global influence.

India complained to the US that China’s String of Pearls strategy is more of a strategic than commercial and the String of Pearls is encircling it from north to south. And also it feel very uneasy because a few of the pearls are India‘s old foe like Pakistan and Sri Lanka. Thus all these developments represent China’s rising geopolitical influence through ports and airstrips and also building diplomatic relations from Hainan Island to Persian Gulf. This also acts as a strategy to cut off US influence in this part of the world and also to contain India’s influence in this area. The following map shows how China’s String of Pearls encircle India and the rest of South Asia.


The Second String of Pearls is taking shape in the Pacific Ocean. China already had a strong presence in the Pacific Islands ever since there is a power vacuum left by the French and the Americans. China’s CHECKBOOK diplomacy did a marvellous job and it helped most of the Pacific Island nations to pay off their debts with no strings attached. Unlike Western aids it comes with a whole list of conditions like human rights, transparency, opening up of market and etc.  

The following are the reasons why China putting so much importance in this area,

  1. One China policy
  2. To counter U.S forces from Guam & Hawaii in case of future confrontation
  3. Strategic positioning of the Pacific

Taiwan has been lobbying the Pacific Nations to recognize it as a country and for a vote in the UN. It was doing this quite successfully for a while with nations like Kiribati, Nauru, Palau, Tuvalu , Marshall Islands, and the Solomon Islands. In return Taiwan will provide aid to them. China came into the scene and counter offered them and eventually of the 24 nations only 6 left that is still loyal to Taiwan. China not only provides aids to them but also build infrastructure like roads, schools and government buildings for them. China already import significant amount of timber and fishes from Papua New Guinea and Solomon islands. China also has an interest in Papua New Guinea’s vast energy and mineral resources through interest in the Ramu Nickel and Cobalt mine. It is reported there are more than 1000 SOEs  doing more than $10 billion in business there last year besides providing a market for Chinese goods.

The Pacific Islands lie between the equator and International Date Line makes it an ideal location for satellite tracking. Kiribati is the only country falls into this category and China in 1997 built a satellite tracking station on the Tarawa atoll. The Tarawa station is also important as it can be used to launch and track rockets (either nuclear warheads or satellites) and also for monitoring US Navy and military installations in the Pacific. This station also played a big role in China’s first-manned space mission and also its future lunar mission. However after suffered some bad diplomatic relations the installation had to be removed.

The third String of Pearls is likely be the African Continent since more than 20% of China’s oil imports come from that region. According to sources, Swakopmund in Namibia currently accommodate China’s third overseas satellite and space telemetry tracking station after the closure of the Tarawa base, is likely be the first pearl. Next will be the other African Nations on the east coast of Africa. The Port of Hambantota in Sri Lanka which has bunkering facilities for ship refuel and supplies provide a perfect docking point for Chinese ships on the way to Africa.


In Conclusion


The development of the Strings of Pearl can be seen as part of China’s ambitious plan to consolidate and tighten its grip on Global power projection. This whole game plan can be seen as part of a strategy that derives from the centuries old Chinese board game called Wei Qi also known as GO in the West. The objective of this game is to move as many pieces of his stone (either black or white) towards the opponent side. In a way it surrounded the opponent with many scattered pieces and then consolidates his position in one or two areas where it will be used for the final push to finish off his opponent.


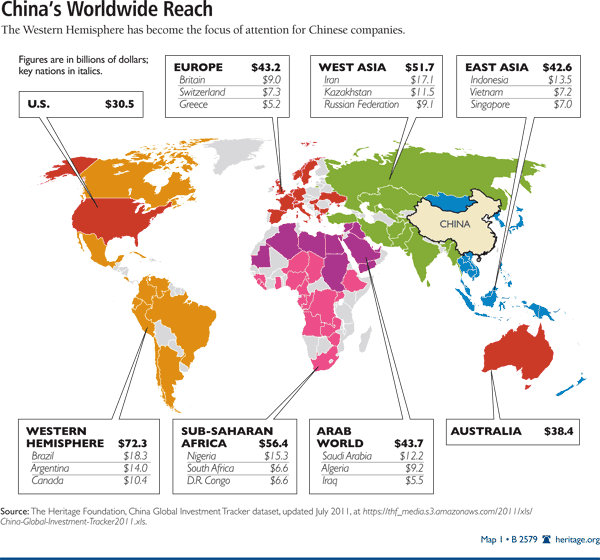
Thus if observe from another angle, China today can be seen as a giant Wei Qi board, where  the pieces represents the Chinese SOEs (State Owned Enterprises) and private Chinese investors be it local or Overseas Chinese or rather known as the Bamboo Network that has spread their wings in all four corners of the Earth. They are starting to move their pieces (investments) and scattering all over the world. Although their move might be sporadic at the moment but in time they will be able to achieve economies of scale and move into areas that shows signs of economic boom quickly. Their strategic locations will give them a head start over any would be competitors in terms of presence and integration into the local economy. The following map best illustrates China’s strategic move by scattering its SOEs around the world where it can be used to capitalize on any positive economic development arising from the different parts of the world.


As seen above China has already made its maiden move to scatter its SOEs around the world and in time it will move into specific areas that offer the best opportunity to further strengthen its influence. In a way the development of the String of Pearls complements China’s future Global economic expansion.

Sunday, December 1, 2013

A Rebuttal to Mahathir on keeping Proton as a going concern

Proton or (Perusahaan Otomobil Nasional Berhad) was incepted in 1985 by the then Prime Minister of Malaysia to help Malaysia industrialise and hence achieve the develop nation status by 2020.  Former PM, Tun Mahathir reckoned that to complement this vision a ‘national car’ program will be best option to fast track the process. His penchant for starting up a ‘national car’ program is partly due to the success of other countries in their ‘national car’ project. Their success in car manufacturing also led to other spinoffs like the thriving auto parts industries. Below is the time line of various countries national car project.  


Country
Year Started
Australia
1944
Japan
1965
South Korea
1974
Indonesia
1976
India
1982
Malaysia
1985


One thing to note, all of them are successful except for Malaysia and Indonesia. Australia started off its ‘national car’ project in cooperation with U.S car conglomerate General Motors in 1944, a national icon by the name of Holden was born. Although Japan’s car industry begin much earlier when Mitsubishi join venture with Fiat to produce the Mitsubishi Model A. It was only during the 1960s where MITI (Ministry of Trade and Industry) embarked on a policy to build a ‘national car’ project to make cars more affordable for its people.


South Korea initiated its ‘national car’ policy in 1974 after the success of the Japanese with KIA partnering Honda and Mazda. Since the 1970s, Indonesia had as many as 15 national cars that come and go that include local names like Marlib, Bimantara, Timor, Morina and so on. India started its ‘national car’ project in 1982 which resulted with the production of Maruti which is a joint venture with Suzuki.  Lastly, Malaysia followed suit and started its ‘national car’ in 1985 with Mitsubishi Motors as its partner.


Proton as a new player will not be able to survive the ultra-competitive automobile market without any help from the Government. As with other car manufacturers, being an ‘infant industry’, Proton received Government help in the form of grants and high import tariffs. As a result, the price of imported cars soared and thus provided a pricing advantage to Proton.
This can be viewed as a sound strategy as it gave ample time for Proton to develop itself into an efficient, low cost and effective competitor. However, after more than 20 years in existence, Proton still unable to compete without high import tariffs. Instead of becoming an efficient competitor, Proton turned into an economic dinosaur much like many of China’s SOE (State Owned Enterprises). Apart from receiving bailouts and grants, it failed to take advantage of the high tariff protection throughout the years to improve its competitiveness. As a result its sales plummet and its market share dropped from 80% in the 1990s to about 26% recently.  


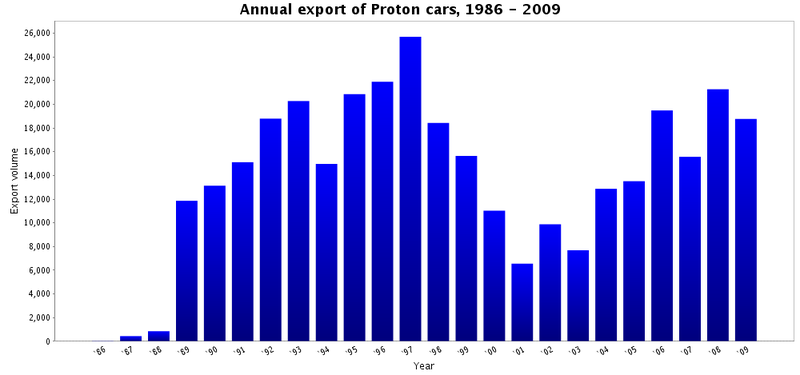
Below is the chart of Proton’s automobile car sales in Malaysia from 2002-2012 and its export sales from 1986 to 2009.


From the chart above, it is obvious that Proton is not making any headway in the export market. In fact, Proton has been losing market share in foreign markets to companies like Hyundai and Kia. In 2010, it only managed to sell less than 1000 cars in the UK whereas during the 1990s it sold more than ten thousand cars each year


There are many views on whether Proton should continue to be a going concern. From the end users point of view, they think that they are short-changed by being forced to buy a high priced and inferior product. Tun Mahathir opined and argued that if Proton were to close shop then negative repercussions such as job loss, closure of local parts manufacturer, high foreign exchange outflow, loss of engineering capability, increased fuel consumption and pollution cannot be avoided.


To a layman those arguments may seem logical and thus keeping Proton as a going concern is the only right option. To me, I reckon those are excuses for covering up the bad policies implemented in the past. Below, I present to you a write up on where our policy went wrong and what we should have done so that Proton would not have ended up like it is today.


Infant Industry Protection


At the beginning, we are heading in the right direction because as a newly industrialised country (NIC) we needed heavy industries to help us industrialise. As a result we started Perwaja Steel, Hicom Industries, Proton and others to help us forged ahead with our industrialisation plan. Proton as a new entrant to the auto industry needed Government assistance and thus import tariff on foreign cars was raised. Due to its inability to compete, what initially started as an ‘infant industry protection’ manifested to ‘monopolistic protection.’  What is Monopolistic Protection?


Monopolistic and Competitive Protectionism


There are two types of protectionism. One is the ‘Competitive Protectionism’ where a large number of protected companies compete with each other on home soil. The other is the ‘Monopolistic Protectionism’ where only one or two companies are protected from foreign competition and thus have control over the whole industry. Monopolistic Competition will hurt an economy as it encourages monopoly in the domestic environment. The problem is that Proton falls into the second category of Protectionism.


Proton’s Monopolistic Protectionism


During the late 1980s till the 1990s, Proton virtually monopolise our local automobile market because there are no other competitors other than Perodua, which only came to the scene at a later date. The problem is that there are many negative effects arising from Monopolistic Protectionism.


Firstly, Proton without much competition can charge a very high price. Able to charge a high price also means that it can afford to pay for over-priced auto parts. Hence this led to the proliferation of crony controlled auto parts manufacturers.  
Secondly, its products are normally poor quality and limited choices. When there are no competitors offering better quality and wider choice of a product, customers will have to succumb to the whims and fancy of Proton. Customers not only have to wait up to 9 months to receive their cars but are also forced to buy the optional accessories as well. To avoid the long wait customers often settled for less popular colours. Some buyers are able to get their cars delivered in less than a month when they pay under table money to sales executives. These practices of fleecing customers are rampant during Proton’s heydays.   
Thirdly, Proton workers from customer relations to mechanics are known to be rude to customers because they know that their customers have no other competitors to choose from. This help explains why Proton still managed to control 80% of our automobile market at one time, even though it’s after sales service sucks.
Fourthly, wages in the auto industry will always be under pressure because there are no other competitors to bid for auto workers. Workers know that if they are fired, it will be close to impossible to find another job with another auto manufacturer. Hence in the end this will further widen our income inequality.


However success led to complacency, they ride on the success of old models for too long thus neglecting the need to introduce new models and observe changing consumer trends. Proton also failed to strengthen its position to keep competitors at bay during this period by adopting newer technologies and production techniques. On top of that, Proton also failed to adopt measures to capitalize on ‘speed to market’ techniques. This refers to speeding up the design to product cycle which not only helped Proton to cut down its cost but also in recovering the associated cost of investing in new engines and models.


Proton also failed to offer many choices because many of its models do not share a common platform. Unable to manufacture on fewer platforms means it cannot capitalize on cost savings arising from shared common design, parts, production and engineering facilities. Proton’s woes exacerbated when AFTA was introduced in 1992. It provided an opportunity for foreign car makers to establish their manufacturing facilities in ASEAN to take advantage of the low intra-ASEAN tariff. This also provided a back door opportunity for foreign car manufacturers to export their cars to other ASEAN members. This is exactly what Thailand’s Big Three (Toyota, Isuzu and Honda) is doing, relocating less competitive production facilities from Australia and other parts of the world to Thailand and then re-export to Malaysia, Indonesia, Vietnam and other ASEAN members. The rest as they said is history. Thus it was Monopolistic Protectionism that killed Proton. What will be the scenario if our Malaysian Government had chosen Competitive Protectionism instead?


Competitive Protectionism


As already explained above, Competitive Protectionism is a situation where there are a large number of protected firms competing with each other on home soil. Competition is necessary to produce higher quality goods at a lower price. It does not matter whether the source of the competition coming from local or foreign because they need to compete to survive. In fact Competitive Protectionism is the SECRET to the success and rapid economic growth of many industrialised nations such as America, Germany, Korea and Japan.  Professor Michael Porter from Harvard in his book ‘The Competitive Advantage of Nations’ said,


‘The domestic market not foreign market led industry development in the vast majority of Japanese industries. Only later did exports become significant and domestic rivalry is the best spark for industrial efficiency.’


This policy has a proven track record for every country that implements it, including the G7 countries. Below, we shall see how Competitive Protectionism help solved many of the problems mentioned by Tun Mahathir.


On Job Loss


To enable a Competitive Protectionism environment to succeed, we first need to open up our auto industry to foreign car manufacturers. This is because the best form of competition comes from foreign companies. The scenario will be that Proton needs to compete with companies like Toyota, Honda, Volkswagen, Nissan, Hyundai, Kia and so on. When foreign companies start their operations in Malaysia, they not only bring along new capital and technology but also create new jobs and thus boost the demand of workers.
Moreover their competition for workers will help raise wages of the workers. Another important development is that due to intense domestic competition existing companies such as Proton may lose ground but those fired workers can find jobs with other competitors. Hence domestic competition not only generates jobs but also improve the quality of cars produced.     


On Foreign Exchange Outflow


As nations grow so does the trade among them and eventually they will all involved in intra-industry trade. What is intra-industry trade? This is a situation where countries tend to export and import similar products. For example, Malaysia export Proton cars but at the same time also import Toyotas, Nissans and other makes. Similarly Malaysia also exports other products like oil, electronic goods and furniture but at the same time it also imports those products. In this case when foreign car companies start manufacturing their cars locally then there is no need to import them from other countries. Hence there is no outflow of Foreign Exchange.


Another point is that eventually, we will be a net gainer of foreign exchange because those foreign companies will export their cars all around the world. Thus, in the end our trade balance will improve and will also help boost our balance of payment. With the excess foreign currency, we can use it to reduce our debt burden by repaying some of our foreign debts.     
Finally, as a result of the reduced need for importation of cars from abroad then our Government can do away with all the APs (Approved Permit). APs have been in much controversy due to the cost and corruption associated with it. Without the APs our car prices will be much cheaper and this will be a boon to all car buyers as it won’t burn a hole in their pockets.
On loss of engineering capability


To begin with there will not be any loss of engineering capability because if our expertise in engineering is of world class then Proton will not be in such a bad shape as it is today. It was our shoddy workmanship, dated car designs and engine performance that prompted many Malaysians to opt for foreign cars. Thus with the intense domestic competition created by foreign car manufacturers, Proton will either had to shape up its engineering capability or risk being ship out. Again if Proton were to close shop, their engineers can then look for jobs in foreign car manufacturers which are technologically more superior and thus there is no loss of engineering capabilities. In fact it might be a boon to our Proton engineers because they are now exposed to newer and more advanced technologies.


On increased fuel consumption and pollution
As I have mentioned earlier, there has been an increased in intra-industry trade within nations. It is estimated that in the U.S and Japan, nearly 60% of their trade are in similar products. Since all trade involves two way shipping across the ocean and skies, a lot of fuel is wasted and thus also polluting the environment. Thousands of ships crossed the oceans every day to transport raw materials and finished goods in four corners of the earth.


If more country were to implement Competitive Protectionism then more goods will be produced in the domestic front and this will help reduce the wastage in fuel. At the same time, pollution in the ocean arising from oil dumped and spilled from cargo ships and tankers will also be reduced. Additionally when manufacturing are localised it not only help reduce the transportation cost of goods from factories to ports but also pollution arising from traffic jams. Hence the environment will be in better shape.


As a result of reduced global transportation of goods then the demand for oil will be reduced and thus will also help free up some capital to produce other goods and services such as building a more efficient transportation system. Lower demand for oil means lower prices and hence more resources can be directed to the production of basic necessities. Hence global GDP will rise and the standard of living of all citizens will further improve.


In summary


As can be seen above the benefits derived from Competitive Protectionism far outweighs that of Monopolistic Protectionism. Competition not only helps a country to increase its prosperity but also reduce its income inequality due to the increase wages. To prove our case we shall use Thailand as our case study. Thailand’s car industry which started in the 1960s also enjoyed high import tariffs from their Government. They started off with auto parts manufacturing and then move on to car assembly. Their auto industry also experienced its ups and downs. Import Tariffs have been increased and reduced to help protect its auto industry.


The Thai auto industry takes off when their Government decided to turnaround their Monopolistic Protectionism policy to Competitive Protectionism. As part of its liberalization program foreign car manufacturers like Volvo do not need to enter into joint venture with local partners as in Malaysia. Apart from incentives to produce eco-friendly cars, their corporate tax rate has also reduced to 20% which is lower than Malaysia.
As a result there are more than 10 foreign car manufacturers made Thailand their home and collectively they produce more than 1.5 million cars annually. This made Thailand the largest car producer in South East Asia and the 9th largest in the world. Further to this, there is another spinoff resulted from being one of the largest car producers in the world. Its auto parts manufacturing business has now topped US$5 billion and is bigger than the rest of the ASEAN members combined.


If Malaysia had not stuck to its plan to protect Proton with Monopolistic Protectionism, then I reckon instead of Thailand, Malaysia will be the 9th largest car producer in the world. Due to our insistence to protect our brand name and cronies, we forgo one of the best opportunities to develop our local car industry. Job loss is a non-event even if Proton were to close down because we will gain more jobs from the foreign manufacturers as to the 150,000 jobs loss estimated by Tun Mahathir.