Tuesday, June 3, 2014

How our Winner Take-All Market Deepen Income Inequality while Decaying Our Education System?


Are we better off than we were 10 years ago? I am sure the majority of us will answer with a resounding ‘NO’. Why is this so? There are many reasons that contributed to this, among them are the following.

  • Increased in income inequality
  • Rising costs of living
  • Income not catching up with inflation
  • Longer working hours and less recreation
  • More indebted than before
  • Less opportunity for self-improvement due to time constraint
  • Society is getting more competitive
  • Crime on the rise

Wonder what caused the above? Listed above are the consequences or the price of economic development that are caused by forces that shaped our social economic fabric. We are living in a world where resources such as land, labor and natural resources are in limited supply or scarce. To maximize the usage we not only have to limit wastages but also need to efficiently allocate these scarce resources to the most important part of the economy.

In a free market economy as we have today, the distribution of resources will be led by the forces of supply and demand created by the ‘invisible hand as known to Adam Smith’.  However, no matter how efficiently resources are allocated there are bound to be situations where inequality exists. Thus, we are confronted with a trade-off between inequality in the distribution of resources and economic development.

Unequal Economic and Wages Growth

When an economy grows there will always be inequality in resource distribution because some people are better equipped to capture a larger share of the economic pie. These qualities include education level, talent, creativity, hard work and the willingness to take risk and will affect the wages and profits accrue to different actors in the economy. Thus some people will be left out by the progress of the economy and below I present to you an analysis on the extent of the inequality.

The following chart on GDP growth shows that our economy prospered throughout the years.

. Malaysia GDP
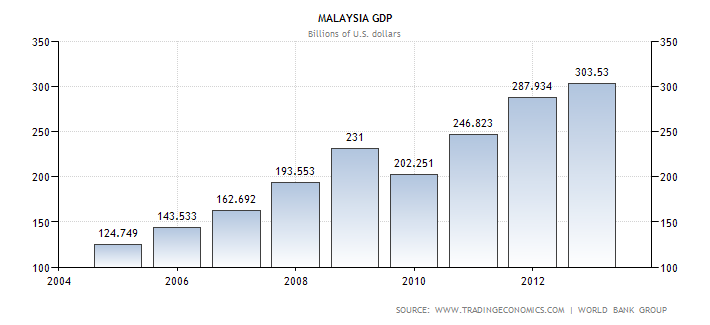
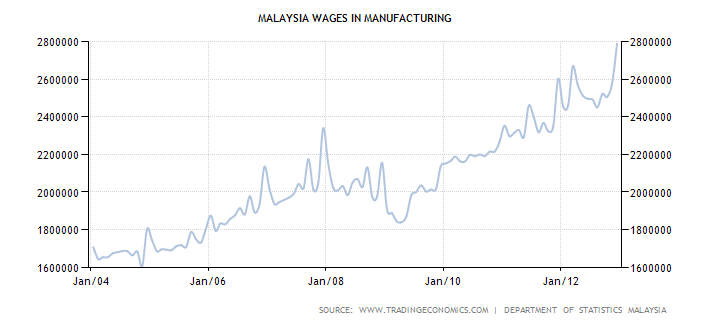
As can be seen from above our GDP grew from $124.75 in 2004 to $303.53 in 2012. This represents a 145% growth during that period. But has our income/wages kept up with the economic growth? To find out I present to you below the chart on the growth of wages in the manufacturing sector. The manufacturing sector was selected as it employs the most people and thus provides a better representation.
Historical Data Chart


The average manufacturing salary in 2004 was around RM17,000 per annum and went up to RM28,000 in 2012. Thus our wages only grew 65% (28000 – 17000 / 17000) during this period. Hence, we can conclude that our wages has not been rising proportionately to economic growth during the period of study (2004-2012). This inequality can best be described in one chart as follows.


GDP as a metric not only used to measure economic growth but also reflects the standard of living of a country. In this case it shows that the rise in our standard of living has not been accompanied by the rise in wages. Obviously this is not good news because the longer this goes on the wider will be the disparity. Since the distribution of income is a zero sum game consequently there will be gainers and losers. So who are the gainers and losers?

The losers will be the workers and the gainers will be the top 10% of the population that controls 35% of our nation’s wealth. The top 10% of the population are folks that make up of shareholders, stakeholders, directors, high level management and so on. Hence, they are the ones that are benefiting from the GDP growth because they are residing at the very top of the food chain. Trickle-down economics indicates that any benefits derived from economic growth such as profits and dividends will have to flow from the top layer of the pyramid. Thus it is not surprising to note that the majority of the gains from GDP growth stop right at the top level of the pyramid while the spillover went to 90% of the population. The extent of the income inequality in Malaysia has grown from bad to worse as we now ranked third in Asia Pacific Region. A summary with no comments can be seen from the graph below.  

Source : World Bank

Income inequality can be measured by a statistical approach called Gini coefficient or index. The Gini index is used to measure the gap between the poor and the rich. The higher the reading the higher is the inequality. High income inequality means higher proportion of the nation’s wealth held by a smaller group of individuals. This also implied that any benefits that derived from economic growth will flow to the higher income group instead of the lower income. Our next question is how much wealth held by the ‘elite’ top 10% and bottom 10% of the population? It can best be describe with the following two charts.
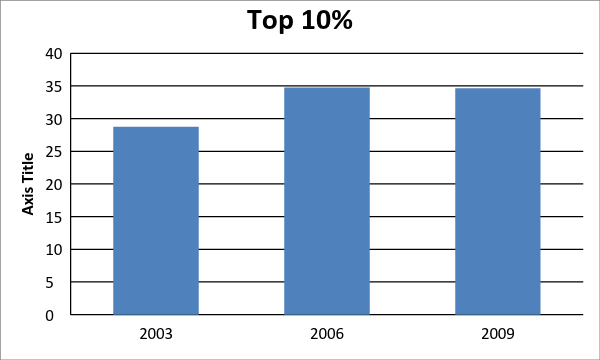


Source: Compiled from World Bank Data

As can be seen, the wealth held by the top 10% of the population increased from 28.77% in 2003 to 34.65% in 2009. At the other end of the spectrum, the wealth held by the bottom 10% of the population decreased from 2.67% in 2003 to 1.78% in 2009. This shows that the wealth held by the bottom 10% dropped by one third or 33.33% (2.67-1.78/2.67) whereas the top 10% increased their wealth by 20.4% (34.65-28.77/28.77) from 2003-2009. So what caused such a great disparity in our income distribution?

What causes the inequality?

Some factors put forward include education level, intelligence, hard work, higher productivity, experience and talent. It may be true because collectively they formed the forces that helped create a ‘Winner Take-All’ market. What is a Winner Take-All market?

In sports, what do Rafael Nadal, Lee Chong Wei and Nicol David have in common? They are the world champions in Tennis, Badminton and Squash respectively and operate in a very niche market called Winner Take-All. As its name implies Winner Take-All gets most of the reward and leaves little to the rest. They operate in an extremely competitive environment where thousands of players all eying for the top position. Top players are rewarded with endorsement fees and advertisement contracts which are very lucrative. Those lower ranked will be lesser known and earn much lower fees. To prove it, does anyone know the current second ranked men badminton or women squash player in the world?  Other than sports, Winner Take-All market also exists in other sectors of the economy.

In the corporate world where competition is fierce any slight advantage may cause a big improvement in the bottom line. Due to the pressure to perform, bidding for talented executives has gotten more intense. This led to an explosion in the salaries of top executives in the corporate world. Companies are increasingly dependent on outsiders rather than executives within their company to run their operations. The surged in income among the top managers further heightened the disparity in income between those at the top and bottom within a company’s hierarchy.  

In politics, various political parties also engage in Winner Take-All market. Whenever the federal announces a project, various State Governments will compete and try to outdo each other in order to convince the authority to relocate the project to their state. Thus there will be demand for political strategist, lobbyist, fund raisers and a whole host of other workers that involve in the political machinery. When they successfully persuade the authority to relocate a project to a particular state then there will be trickle down economic benefits such as more job and business opportunities for the local population.

Around the world, countries also engaged in Winner Take-All market competition. In today’s competitive world human resource plays an important role in the development of a country’s economy. We need the right people to do the right job such as people with background in economics and finance to run our finance ministry or people who are good in management skills to run our Government Linked Companies. What happens when we lacked the talented people to fill those positions?  We have to source it elsewhere. We will attract talents from other countries by offering higher wages and better benefits or in other words we encourage ‘Brain Gain’. If we are not doing it then someone else will and this will lead to ‘Brain Drain’.

Another flip-flop policy implementation is the reversion the use of English from our school syllabus to Bahasa Malaysia. After 5 years of implementation only we found out that we are producing non-marketable graduates due to the lack of skills in English.  English can be considered the de facto language for business in both the private and public sector in more than 50 countries. More than 15% of the world population speaks English and 80% of the information stored in computers is in English. The growing importance of English also helped give rise to winner take-all market by reducing the costs of information (no need to translate) and also increasing the networking of people around the world. Thus with the efficient flow of information on prices and cost of transportation plus an enlarge audience of suppliers and customers it helped intensify the competition.

However, according to a report by The Straits Times’s Asia Report in Oct 2013, almost a quarter of the 470,000 Form Five students failed English in 2012. And according to the education ministry 70% of the 70,000 English teachers failed a competency test to teach English. In the 2009, Malaysians students ranked third from the bottom out of 74 countries in the PISA assessment. The results show that our ‘flip flop public policies’ are taking its toll on student performances.  

In education, universities also engaged in the Winner take-all market. For the past decade or so, the quality of our education system has gone anywhere but up. Evidence can be seen from the absence of our Public Universities from Times Higher Education ranking. Times Higher Education can be considered the authority in University Ranking where they are judged according to 13 performance indicators from five areas – teaching, research, knowledge transfer and international outlook.  

According to Times Higher Education World University Ranking 2012-2013, Malaysian Universities failed consecutively for two years to enter into the top 400 spot. To add salt to injury there are 81 universities from the Asia Pacific region made it to the top 400. So what cause the decadence in our Education System? One major factor overlooked by our authority is the existence of winner take-all market in our education system. How will the Winner Take-All market in our education system lead to erosion of quality in our public universities?

Winner Take-All Market


Why the standards of our Public universities are dropping drastically in recent years? Due to increasing competition in the labour market, academic credentials have become more crucial in determining the marketability of a student in the job market. Good academic credential is also important for students seeking acceptance into post graduate courses in reputable universities.

Top jobs and Top schools

World class Management Consulting companies like McKinsey & Company and the Boston Consulting Group are known to be a magnet for most talented professionals. A survey was done by Fortune magazine in 1990 to determine the relationship between top jobs in the business world and elite schools. What they found is that out of the 1500 respondents almost 93% of them graduated from Ivy League universities such as Harvard, Yale, Princeton, Stanford and so on. In addition, the number of CEOs graduated from the Ivy League universities also increased from 15% to 19%.

Thus, it is no surprise that students are now more selective in choosing which universities to attend when they graduate from high schools and colleges. Hence, there will be competition among universities to upgrade their facilities and faculties or they will risk losing top students. To upgrade their faculties, universities are forced to compete for able and famous professors. Thus this helped gave rise to a winner take-all market in education. As a result, salaries for well-known professors and administrative staffs have risen substantially. Public universities that are not keeping up will risk losing many of their top academicians to private universities. In fact many of our public universities are already suffering from this ‘Brain Drain’ syndrome in recent years.

A good example is the recent fiasco in University Sains Malaysia’s medical faculty. Due to low pay and lack of meritocracy that prohibited promotions, many of its teaching staffs have left for greener pastures in local and foreign universities. The once well-known and vibrant medical faculty is a shadow of its past and now it is at the verge of closing down.

Increase in Top 20% Household Wealth

Another factor that causes our public universities to lose students is the rise of the income of the top 20% household. As seen below the top 20% household in Malaysia now controls 51.45% of our country’s wealth.
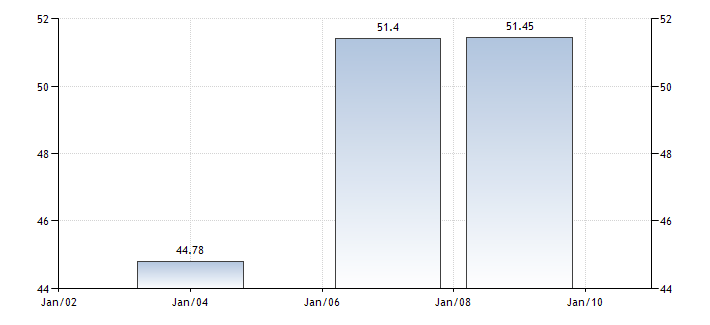

 malaysia income share held by highest 20percent wb data
Source : World Bank

Tuition fees in private universities have risen in tandem with increased demand in recent years. Fortunately, due to the increase in income for the top 20%, more parents are able to send their children to study in private universities. To capture the growth in student intake, private universities are also expanding their faculties. Thus this also helped to cater to the increasing number of students seeking education in elite private universities.  

Success begets Success

Academic excellence feedback loop also plays an important part in attracting top students. In simple terms, academic excellence feedback loop refers to a situation where better students attract better students. As mentioned earlier having an excellent faculty is important in attracting students. But on the other end having good students also tend to attract a better faculty in terms of teaching staff. This is because faculty members are more incentivized to teach in a prestigious institution with good passing grades than a less prestigious one.

The quality of a faculty is measured by the amount of research being done and articles publish in their respective journals. Being associated with better known universities, professors are assured of research funds, increase demand for books written by them and better opportunities for landing a consulting job. The reputation of a university will further enhance when it has an excellent team of academia. Thus, to be on the top universities will need an eco-system of good students and faculty because they reinforce each other. This also helped explain why certain universities go to the length of providing financial aid such as scholarships and loans so as to attract the best students.    

Employers and Students feedback loop

Another pull factor that makes student more attracted to private universities is the increased number of top companies having their on-campus recruitments there. The reason for top companies doing their on-campus recruitment in private universities is due to their concentration of top students. Hence, there exist another feedback loop between top students and top employers. In the end, private universities tend to gain from the concentration of top students because employers will also concentrate their recruitment drive there. We will be seeing more of this ‘jobs go to the people’ phenomenon in the future as our economy gets more creative.  Another benefit students can derive from concentration of top students is the networking of students within the alumni. When they start work later in life it will be a boon for them to know who’s who in the market.  

Changing Demographics

Demographics also played an important part in giving rise to winner take-all market in education. Unknown to many, although our population is growing our country is also heading into a demographic crisis. Why is this so? Let me present you the following two charts. The first one depicts the percentage of our population aged between 0-14 years old. The second shows the percentage of our population aged above 65 years old.

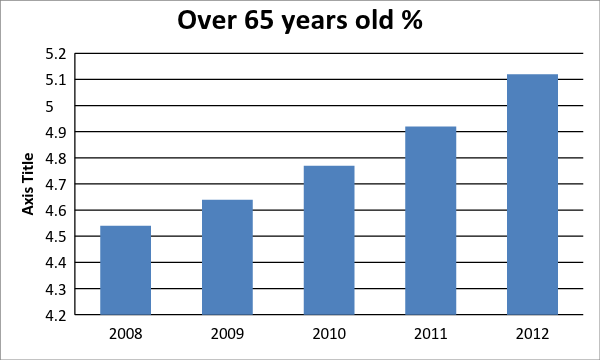


Source: Department of Statistics Malaysia

I hope you are able to notice the diverging trend in our population composition. The percentage of Malaysians aged above 65 years old has increased from 4.54% to 5.12%. What this means is that our population is fast aging. This is not good sign for the economy because our government will have to increase its spending on healthcare to support this group of people in the future. Since our government has been running budget deficits then increase spending on other social programs like education and disability will be a challenge.  

Further, as you noticed the percentage of Malaysians aged between 0-14 years old has decreased from 31.2% to 29.5%. What does this tells us? It tells us that in future there will be a decline in students going to schools which also resulted in lesser students entering universities. Thus, colleges and universities will have to buck up and spend more on attracting and recruiting students in future. This inadvertently led to a winner take-all market because universities will have to outdo each other in attracting students. Again the loser will be the public universities if they are unable stand up to the challenge. The search for top educators and faculty staffs again will lead to an explosion in salaries.     

Wrapping Up

Thus, it can be seen that the battle of education supremacy has led to many negative developments such as rising salaries of lecturers and professors, growing faculty members, more expensive laboratories and libraries. In sum all these have led to increasing pressure on university budgets. The only way out is by increasing the tuition fees.

As evident from above, improvements in the private universities will only benefit the top 20% of the population. Students who cannot afford the high fees in private universities will have to contend with public universities whose standards are affected by the ‘Brain Drain’ of their academic staffs.

Another implication is that whichever university reacted first on the information above will be in an advantageous position in the future. When we know the following,

  • Increased household income of the top 20%
  • Fewer students enrolment in high schools in coming years
  • Less funding on education by the authorities   
  • Student and Faculty feedback loop
  • Student and Employer feedback loop

Then according to Game Theory, whichever party acted first on the information will always be in forefront of the game. The Game Theory that I am referring to here has nothing to do with the Safari in Africa but a study on strategies on how to out-manoeuvre your opponents. Understanding Game Theory will equip us with tools to not only predict the future outcome but also see through our opponent’s strategy. Game Theory is also being used extensively in politics especially in Western countries not only to strategize but also to see through the opponent'strategy.

In this case the strategic advisor to a university already knew the future problems of the government and other universities. It also knew what type of quality education students are looking for in their pursuit of further studies. When he utilizes a theoretical game strategy called ‘look ahead and reason back’ he already knows what his competitor going to when the time comes. Thus all the strategic advisor needs to do at the mean time is tailor-made a marketing plan emphasizing on its strong point to lure students away from their competitors.     


The author is the Economic Advisor to the National Union of Bank Employees.

.


Tuesday, May 20, 2014

Is Malaysia Doomed?

Malaysia’s debt fuelled economy on steroids was the result of Bank Negara’s policy of low interest rates and the abundant availability of credit. To avert the economy from free falling credit expansion measures are taken to stabilize the economy. Economic growth as measured by the GDP is now a function of Government and private consumer spending financed by the credit expansion or put it simply ‘debts’. In the short run this might help mitigate the pain associated with a slowing economy such as a recession. Preventing a recession also means preventing the economy from performing its natural task on rebalancing such as getting rid of excesses accumulated along the way. One of the side effects of excesses is the inflating of assets prices to bubble levels. As a result we have various bubbles blown in the stock market, real estate, bonds and futures market in Malaysia.


Mis-allocation of Resources


Bubbles are created by misallocation of resources because credit is not directed to the most efficient part of the economy. Take for example to prevent a downturn in our housing market, interest rates are kept low and credits are made easily available. With low down payments our local speculators are able to purchases a few houses in one go due to the low monthly mortgage payments. It is like buying a lottery ticket where the returns are very high with a small investment. This can happen in the housing market if speculators can find greater fools to buy it from them every few months. With leverage of up to 300% in margin accounts, it will be difficult to prevent people from buying lottery tickets in the stock markets as well. Betting on such high leverage can only go on as long as the markets kept going up. There will be bloodbath when the markets implode sooner or later. Other form of misallocation of resources or mal-investments happening around  our country includes the following.


  • Crony capitalism. Bankrolling cronies at the expense of other businesses in the economy. A good example will be supplying cheap electricity to IPPs (Independent Power Producers).
  • Bailing out GLCs. Bailing out loss making GLCs like MAS, Proton and so on does not help improve the economy. It’s like throwing money into a bottomless pit. Better channel the funds to provide credit to other industries to help improve their capacity and efficiency.
  • Cost Overruns in public projects. A good example is the recent KLIA 2 project. Construction costs have ballooned from an initial RM1.7 billion to more than RM 4 billion. One way to justify cost overruns due to the rise in raw material prices, raining season and so on is by issuing VO or Variation Orders. Variation Order is one method used by companies participating in a tender exercise to quote at a very low price. Once they landed the projects then they will use Variation Orders to mark up the costs of the project and hence generate hefty profits in the end.       
  • Overpriced Public Sector Procurement. Recent report by the Auditor General reveals of exorbitantly over priced items supplied to our Government. Procurements of RM500 screw drivers, RM2000 car jacks and RM30,000 notebooks are common occurrence in the public sector.
  • Wastages. Again the Auditor General also reveals massive wastage in the public sector. Buying things like odd sized safety shoes, under powered computers, building unusable open air public futsal courts, unsuitable or unusable defence assets and so on.     


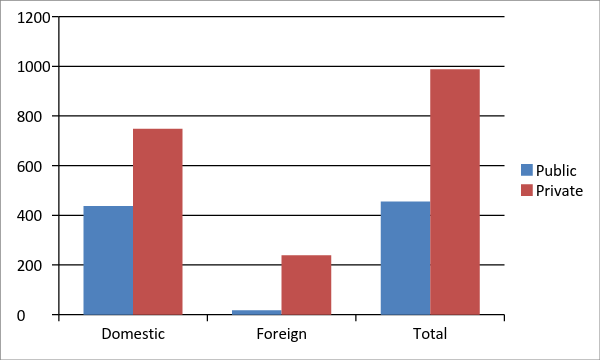
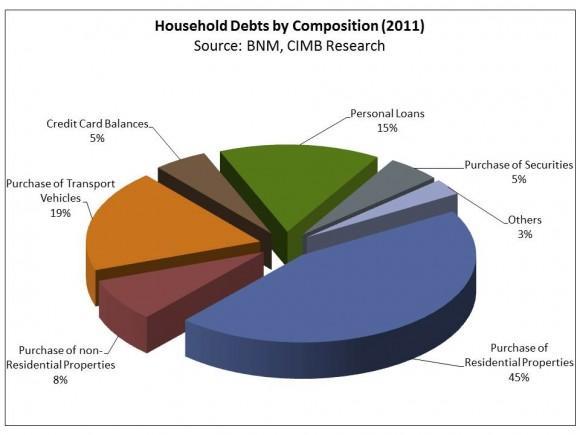
The above shows how our Government literally throw ‘good money after bad’ but that is just the tip of the iceberg. Earlier attempts to bolster consumer spending to lift the economy is not a long term solution either. As a result of the easy availability of credit through channels such as personal loans and credit cards, consumers are spending recklessly on fine dining, overseas travel, luxury goods and so on. The following graphs illustrate the composition and extent of the debts incurred by both the private and public sector in 2012.

Debt
Domestic
Foreign
Total
Public
438
18
456
Private
749
239
988


Debt
Domestic
Foreign
Total
Public
51%
2%
53%
Private
87%
28%
115%


http://www.businesscircle.com.my/wp-content/uploads/2013/04/FIGURE-3-580x435.jpg

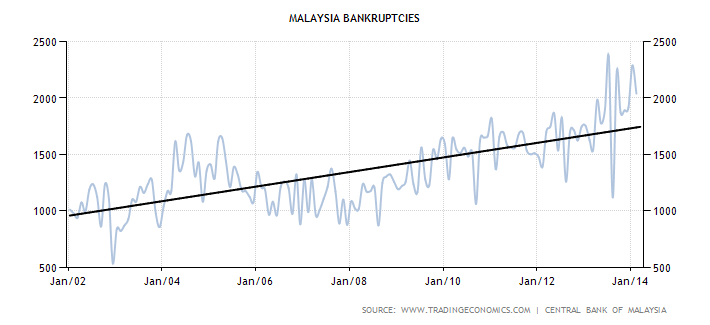
From above we can see that our households are spending un-necessarily. More than 70% of the debts are incurred by properties and followed by vehicles purchase. This unscrupulous spending has led to many of them unable to repay their debts and thus went into bankruptcy.  The following graph shows the number of bankruptcy cases in Malaysia is on the rise since 2002 and heightened after 2008.


  Historical Data Chart


Repercussions of Debt Addiction


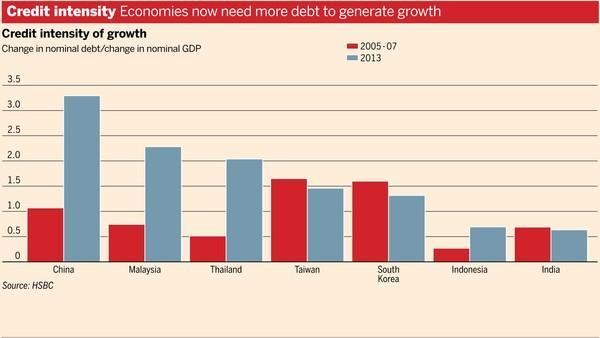
A recent study by HSBC shows that Malaysia’s addiction to debt has gone to unsustainable level and being one of the highest in Asia after China. Malaysia’s credit intensity of Growth has increased to more than 2x in 2013. Credit intensity to growth measures the amount of borrowing or debt to achieve a unit of growth. Studies have shown that in normal circumstances in an efficiently managed economy a $1 debt will generate an increase of $1.60 in GDP growth. This is because due to the effects of fractional reserve banking and the multiplier effect generated from bank loans, the resultant GDP growth should be higher than money supply.  


However as shown by the chart below, the credit intensity of growth in Malaysia soared from 0.7x during 2003-2007 to about 2.3x in 2013. This means that efficiency of capital utilization in Malaysia has been decreasing. To make it simple, during 2003-2007, we needed about RM0.70 to produce RM1 of GDP but in 2013 it went up to RM2.30. Thus our Government need to borrow more money to maintain the existing level of GDP growth.


http://www.zerohedge.com/sites/default/files/images/user5/imageroot/2014/05/credit%20intensity%20asia.jpg


There are many ways a country can increase its economic growth like increasing productivity, capital investments, enhancing efficiency through technology, production processes and so on. To achieve any meaningful level of economic growth, the amount of funds invested into the economy should produce at least an equal amount of economic growth. In an efficient economy, this will mean that an X amount of investment should produce an X amount of growth. In layman’s term a RM 1 input (debts) should produce a RM 1 output in GDP.  In a debt laden economy like Malaysia, our Government has to increasingly rely on debts to enhance its economic growth.
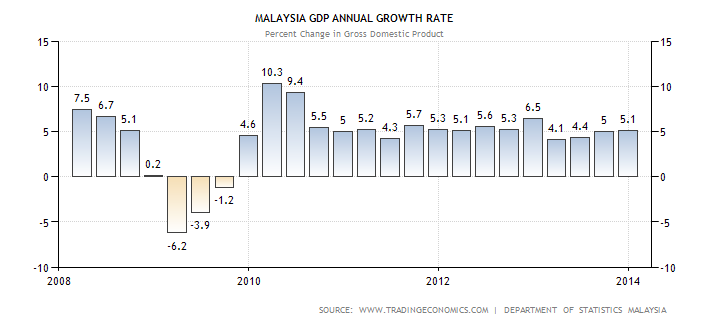
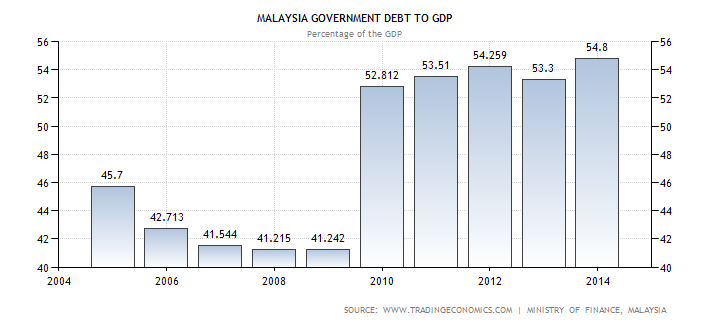
Before we go on let me present you two graphs which are important for our analysis. Those are the GDP annual growth rate and Government Debt to GDP.


Malaysia GDP Annual Growth Rate


Malaysia Government Debt To GDP

The following table is generated from the above GDP growth, Government Debt to GDP and the GDP growth rate to Government Debt.

Year
GDP Growth %
Debt/GDP %
GDP Growth/Debt %
2008
4.87
41.24
11.8
2009
-6.7
52.82
-12.6
2010
7.55
53.51
14.1
2011
5.12
54.25
9.4
2012
5.62
53.3
10.5
2013
4.65
54.8
8.4
Source: Department of Statistics Malaysia


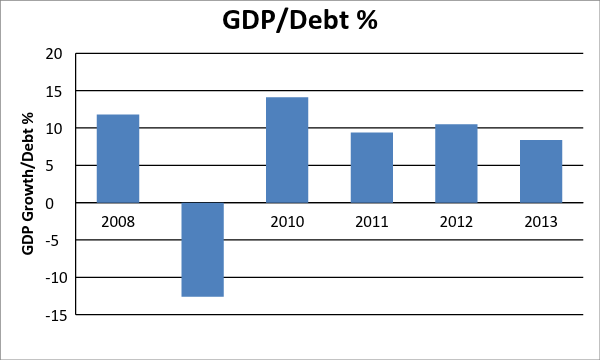
As can be seen, the third column which is the GDP/Debt growth rate has been sliding since 2010. The negative ( -6.7%) growth rate in year 2009 was due to the effects of the Global Financial Crisis in 2008. However economic growth did picked up in 2010 to 7.55% but at the expense of higher debt load which seen soared from 41.24% to 52.82%. This represents an increase of 28% in the Debt/GDP. This can be illustrated graphically below.


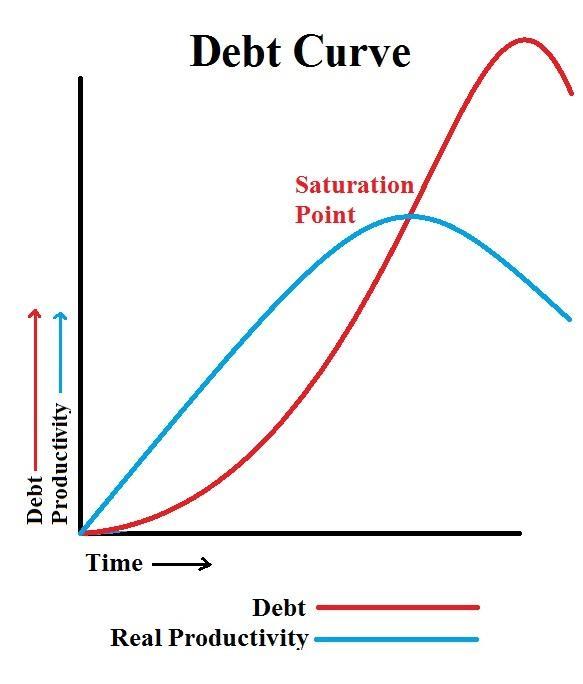
The above chart illustrates the effects of earlier mal-investments on our economy. Due to misallocation of resources much precious capital are wasted because they are redirected to inefficient sectors of the economy. Thus there is not much economic benefit or productivity generated from those investments.  As a result the GDP Growth/Debt or economic growth generated by debt has been sliding downwards since 2010 from 14.1% to 8.4%. Although our Government Debt to GDP increased to a record 54.8% which is only a tad lower than the stipulated 55%, we achieved a lower GDP growth of 4.65%. The reason for this is that we have reached a diminishing return on our debts which can be shown by the following graph.


https://blogger.googleusercontent.com/img/b/R29vZ2xl/AVvXsEg39K8VTgcDKd6yDvBeAdHfCCZr7IM76gFbOonkUYCODSF9PydDPb0yz9ITTAdIDd0onklr8JfJ9gw0vPh9TQZW0boLc-oJPjn_cZKj_W7Zi2RP4FYsFj77V445YO5amf_yprT6RbOtuA/s1600/Debt+Curve.jpg


As seen there will be a saturation point where any additional debt will not boost productivity and thus increasing the debt load will lead to lower productivity.
Another setback of depending on debts to finance economic growth is the increasing amount of future interest payments. If we use the current benchmark of 10 year bond rates which is 4.01% as our costs of funds then the interest rates due to our Government in 2013 will be (4.01% x RM456 billion) = RM18.69 billion. Please note that our interest payment will rise this year because not only our Government Debt/GDP has risen to 54.8% last year but our GDP also rose by 4.65% last year. Below I present to you the estimated amount of interest due to our Government this year, where:


10 Year Interest rate = 4.01%
Government GDP/Debt in 2013 = 54.8%
GDP in 2012 = US$303.53 billion
GDP in 2013 = (4.65% x US$303.53) = US$317.64 billion
Today’s Exchange rate USD/MYR = 3.21
Thus,
Interest Due = 4.01% x $317.64 billion x 3.21 x 0.548 = RM 22.4 billion.


What other repercussions?


There are three consequences arises from using debts to finance economic growth.
Firstly, there is a trade off in what we called ‘opportunity costs’ in economics. Opportunity costs in this case refer to alternative ventures that are forgone in order to pay for the interest rates. Money used to pay interest rates instead can be diverted to build more schools, hospitals, roads, bridges or parks for that matter for the benefit of the people.
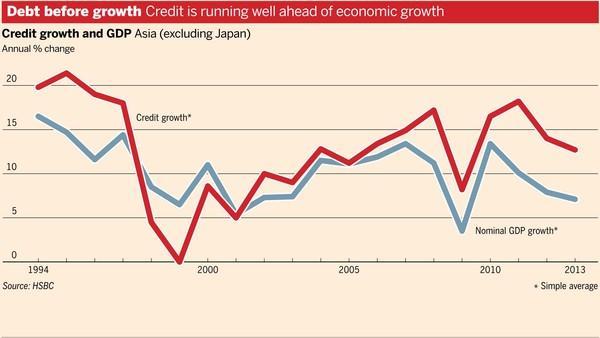
Secondly, due to the diminishing return on debts, more money will be needed to achieve the same amount of growth. To further accelerate growth obviously more debts will be incurred due to the mal-investment arises as a result. So, what is the point of diverting more money into a bottomless pit? The following chart shows this phenomena that is affecting not only Malaysia but most of Asia.


http://www.zerohedge.com/sites/default/files/images/user5/imageroot/2014/05/Credit%20growth%20asia.jpg


Lastly and most importantly our Government is plundering tomorrow’s treasure today.  As seen, our interest payments will keep rising when as long as we are addicted to debts. Put it simply, we are spending our children’s wealth and leaving them paying the bills tomorrow. What used be the traditional Capitalistic model of economic growth where capital is generated from savings as a result surplus production. It has now transformed into a something for nothing economic system where we don’t need to save in order to generate capital. Governments can now generate capital by a new technology called the ‘Printing Press’ where they can churn out as much money as they can. The ability to print money has led to an enormous abuse of power by our politicians as they can buy influence and power through corruption. And at the same time they can prohibit capitalism, competition and freedom which led to many monopolies in our country. Monopolistic companies such as Tenaga Nasional and Plus are able to maintain high prices and raising prices without the need to worry about competitors. Thus, we don’t need to be a rocket scientist to figure out why RM1 in debt generates less than RM1 in GDP growth is not sustainable. It is just a matter of time when our economy will be crash landing. The current state of affair of our country can best be summed up by the following phrase.


When you see that in order to produce, you need to obtain permission from men who produce nothing; when you see that money is flowing to those who deal not in goods, but in favors; when you see that men get rich more easily by graft than by work, and your laws no longer protect you against them, but protect them against you...you may know that your society is doomed.
- Ayn Rand

Friday, May 2, 2014

How the world's wealth is distributed - the top two percent own half of it

How the world's wealth is distributed - the top two percent own half
December 6, 2006
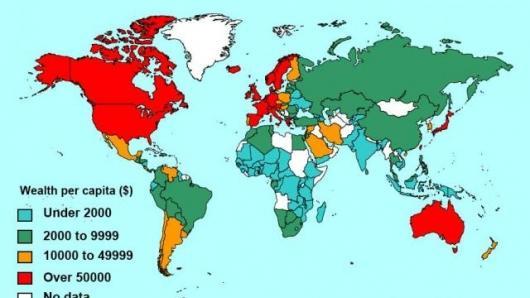
Figure 1 - World Wealth Levels in Year 2000
Image Gallery (8 images)
December 7, 2006 A new study on The World Distribution of Household Wealth by the Helsinki-based World Institute for Development Economics Research of the United Nations University was launched earlier this week. The study shows the richest 2% of adults in the world own more than half of global household wealth. The most comprehensive study of personal wealth ever undertaken also reports that the richest 1% of adults alone owned 40% of global assets in the year 2000, and that the richest 10% of adults accounted for 85% of the world total. In contrast, the bottom half of the world adult population owned barely 1% of global wealth. The research finds that assets of US$2,200 per adult placed a household in the top half of the world wealth distribution in the year 2000. To be among the richest 10% of adults in the world required US$61,000 in assets, and more than US$500,000 was needed to belong to the richest 1%, a group which — with 37 million members worldwide — is far from an exclusive club.
  • Figure 2: Regional Wealth Shares
  • Figure 4: Regional Composition of Global Wealth Distribution
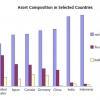
  • Figure 7: Asset Composition in Selected Countries
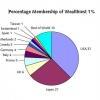
  • Figure 6: Percentage Membership of Wealthiest 1%

The UNU-WIDER study is the first of its kind to cover all countries in the world and all major components of household wealth, including financial assets and debts, land, buildings and other tangible property.
‘One should be clear about what is meant by “wealth”,’ say co-authors James Davies of the University of Western Ontario, Anthony Shorrocks and Susanna Sandstrom of UNU-WIDER, and Edward Wolff of New York University. ‘In everyday conversation the term “wealth” often signifies little more than “money income”. On other occasions economists use “wealth” to refer to the value of all household resources, including human capabilities.’
‘We use the term in its long-established sense of net worth: the value of physical and financial assets less debts. In this respect, wealth represents the ownership of capital. Although capital is only one part of personal resources, it is widely believed to have a disproportionate impact on household wellbeing and economic success, and more broadly on economic development and growth.’
Wealth levels across countries
Using currency exchange rates, global household wealth amounted to US$125 trillion in the year 2000, equivalent to roughly three times the value of total global production (GDP) or to US$20,500 per person. Adjusting for differences in the cost-of-living across nations raises the value of wealth to US$26,000 per capita when measured in terms of purchasing power parity dollars (PPP$).
The world map shows per capita wealth of different countries. (Figure 1: World Wealth Levels in Year 2000) Average wealth amounted to $144,000 per person in the USA in year 2000, and $181,000 in Japan. Lower down among countries with wealth data are India, with per capita assets of $1,100, and Indonesia with $1,400 per capita.
Per capita wealth levels vary widely across countries. Even within the group of high-income OECD nations the range includes $37,000 for New Zealand and $70,000 for Denmark and $127,000 for the UK.
Wealth is heavily concentrated in North America, Europe, and high income Asia-Pacific countries. People in these countries collectively hold almost 90% of total world wealth. (Figure 2: Regional Wealth Shares) Although North America has only 6% of the world adult population, it accounts for 34% of household wealth. Europe and high income Asia-Pacific countries also own disproportionate amounts of wealth. In contrast, the overall share of wealth owned by people in Africa, China, India, and other lower income countries in Asia is considerably less than their population share, sometimes by a factor of more than ten. (Figure 3: Population and Wealth Shares by Region)
The study finds wealth to be more unequally distributed than income across countries. High income countries tend to have a bigger share of world wealth than of world GDP. The reverse is true of middle- and low-income nations. However, there are exceptions to this rule, for example the Nordic region and transition countries like the Czech Republic and Poland.
The authors of the UNU-WIDER study explain that in Eastern European countries ‘private wealth is on the rise, but has still not reached very high levels. Assets like private pensions and life insurance are held by relatively few households. In the Nordic countries, the social security system provides generous public pensions that may depress wealth accumulation.’
World wealth inequality
The concentration of wealth within countries varies significantly but is generally high. The share of the top 10% ranges from around 40% in China to 70% in the United States, and higher still in other countries. The Gini value, which measures inequality on a scale from zero to one, gives numbers in the range from 35% to 45% for income inequality in most countries. In contrast, Gini values for wealth inequality are usually between 65% and 75%, and sometimes exceed 80%. Two high wealth economies, Japan and the United States, show very different patterns of wealth inequality, with Japan having a wealth Gini of 55% and the USA a wealth Gini of around 80%.
Wealth inequality for the world as a whole is higher still. The study estimates that the global wealth Gini for adults is 89%. The same degree of inequality would be obtained if one person in a group of ten takes 99% of the total pie and the other nine share the remaining 1%.
Where do the world’s wealthy live?
According to the study, almost all of the world’s richest individuals live in North America, Europe, and rich Asia-Pacific countries. Each of these groups of countries contribute about one third of the members of the world’s wealthiest 10%. (Figure 4: Regional Composition of Global Wealth Distribution)
China occupies much of the middle third of the global wealth distribution, while India, Africa, and low-income Asian countries dominate the bottom third.
For all developing regions of the world, the share of population exceeds the share of global wealth, which in turn exceeds the share of members of the wealthiest groups. (Figure 3: Population and Wealth Shares by Region)
A small number of countries account for most of the wealthiest 10% in the world. One quarter are Americans and another 20% are Japanese. (Figure 5: Percentage Membership of Wealthiest 10%)
These two countries feature even more strongly among the richest 1% of individuals in the world, with 37% residing in the USA and 27% in Japan. (Figure 6: Percentage Membership of Wealthiest 1%)
According to Anthony Shorrocks, a country’s representation in the rich person’s club depends on three factors: the size of the population, average wealth, and wealth inequality.
‘The USA and Japan stand out’, he says, ‘because they have large populations and high average wealth. Although Switzerland and Luxembourg have high average wealth, their populations are small. China on the other hand fails to feature strongly among the super-rich because average wealth is modest and wealth is evenly spread by international standards. However, China is already likely to have more wealthy residents than our data reveals for the year 2000, and membership of the super-rich seems set to rise fast in the next decade.’
Composition of household wealth
The UNU-WIDER study shows major international differences in the composition of assets, resulting from different influences on household behaviour such as market structure, regulation, and cultural preferences.
Real property, particularly land and farm assets, are more important in less developed countries. (Figure 7: Asset Composition in Selected Countries) This reflects not only the greater importance of agriculture, but also immature financial institutions.
The study also reveals striking differences in the types of financial assets owned. Savings accounts feature strongly in transition economies and in some rich Asian countries, while share-holdings and other types of financial assets are more evident in rich countries in the West. (Figure 8: Composition of Financial Wealth in Selected Countries)
According to the authors of the UNU-WIDER study, savings accounts tend to be favoured in Asian countries because ‘there appears to be a strong preference for liquidity and a lack of confidence in financial markets. Other types of financial assets are more prominent in countries like the UK and USA which have well developed financial sectors and which rely heavily on private pensions.’
Surprisingly, household debt is relatively unimportant in poor countries. As the authors of the study point out: ‘While many poor people in poor countries are in debt, their debts are relatively small in total. This is mainly due to the absence of financial institutions that allow households to incur large mortgage and consumer debts, as is increasingly the situation in rich countries’
The authors go on to note that ‘many people in high-income countries have negative net worth and—somewhat paradoxically—are among the poorest people in the world in terms of household wealth.’
The World Institute for Development Economics Research of the United Nations University (UNU-WIDER) was established in 1985. The institute undertakes multidisciplinary research and policy analysis on structural changes affecting the living conditions of the world’s poorest people; provides a forum for professional interaction and the advocacy of policies leading to robust, equitable, and environmentally sustainable growth; and promotes capacity strengthening and training for scholars and government officials in the field of economic and social policy making.