Monday, March 2, 2015

Implications of GST on the Malaysian Low and Middle Income Earners

The task of the taxing authorities is to "so pluck the goose as to obtain the largest amount of feathers with the least amount of hissing." We the taxpayers, of course, are the geese.
Jean-Baptiste Colbert

The highlight of our Budget 2014 is the long anticipated introduction of the 6% GST or Goods and Services Tax. Under the current tax regime we pay 10 % sales tax (mainly manufacturing goods) and 6% service tax (mainly on F&B). To illustrate how the operations of a company in Malaysia will be impacted by the implementation of the GST we will use the following scenario. By April 2015, a company that meets the criteria will have to have to pay the Goods and Services Tax. Why take the trouble of implementing GST when the older methods of taxation works fine.  

Why GST is implemented?

There are many reasons for the implementation such as:

  1. To widen the tax base rather than relying on current corporate and personal income tax.
  2. Our income tax level has reached its political limits currently hence our government will have to look at other alternatives.
  3. Government Deficits has to be financed through an alternative source that will not increase our Government debt burden.   

To see why our tax base is very narrow I present to you below the chart for our country’s income distribution. Malaysia can be considered to have one of the worst income disparities in the world and certainly tops in Asia.  As can be seen form the chart below, the top 10% of the population controls 38.4% of our country’s wealth while the bottom 10% controls only 1.7%. I suppose this explains why only 10% of our population pays income tax!!

The second chart displays Malaysia being on top spot in Asia’s richest/poorest 10% disparity chart. This clearly shows that our tax limit has already been reached and further hike in taxes will surely infuriate the top 10% of the population. By now you should know who made up the top 10% which is none other than the cronies or the special interest group (UMNO) plus their relatives and friends. In order not to cause further resentment to this group the government had no choice but to find an alternative taxing method.   


http://upload.wikimedia.org/wikipedia/commons/b/ba/Malaysia_Income_Disparity.png

http://photos1.blogger.com/blogger/4493/2864/1600/Iincomedisparity.jpg


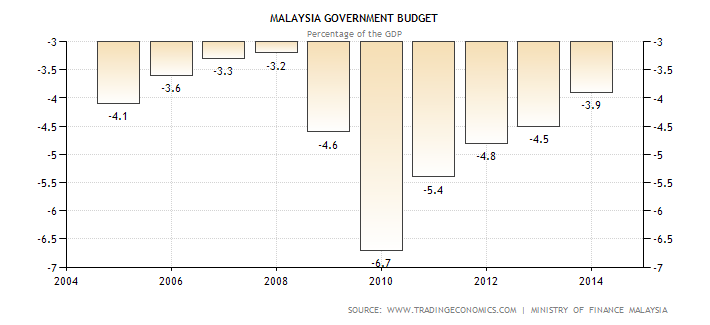
Secondly, our Government is currently running a budget deficit to the tune of 3.5% to GDP as shown by the graph below. A Budget deficit is a situation where it spends more than it received. To finance its spending our Government needs to either raise money through money printing, taxes, royalties, levies and other sources or through borrowing. The problem is that currently our Government’s debt is at 54.8% to GDP and capped at 55%.


Malaysia Government Budget


Malaysia Government Debt to GDP


Since its Debt/GDP is nearing the ceiling, our Government will have limited options to raise funds other than increasing taxes or reducing subsidies. These measures will fall into the non-monetize or deficit financing category. As its name suggests Non-monetize does not increase our Government’s debt because it will not increase the existing money supply. The reason why non-monetize activities does not increase the money supply is because it mainly involves a shuffling of money. Or put it in layman’s term it is the shifting of money from the left pocket to the right.

To illustrate, we take an example from our petrol or sugar subsidy. When our Government reduces its subsidies, money will be transferred from the public to the Government coffers because the public is paying higher price for absorbing the subsidies. The existing money supply is the same but our Government now has a bigger share of it and hence more money to spend. Similarly when our Government implement GST it also resulted in the transfer of money from the public to the Government. Since the GST is proportionally taxed meaning everybody, including the 90% that didn’t pay taxes will also be affected. Hence by shifting money from the left pocket (public) to the right pocket (Government) our Government is expected to add more than RM 20 Billion to its coffers.

What are the shortcomings?

As a result of the implementation of the GST, it is not going to be a smooth ride. Below are some of the repercussions that will be resulted from it.

  1. A rise in corruption. Any company that qualifies for GST will be subjected to the authority’s scrutiny hence is obliged to keep an orderly and tedious account. They have to report all their incomes, expenditures and the amount of tax to the authorities. As empirical evidence emerged from European countries with experience with VAT, companies tend to over-inflate their expenditures and hence reduce their value added. Discrepancies are bound to happen and this will give an opportunity for the powers to be to abuse their power and hence corruption. In the end it helped flourishes a brand new industry and that is faking invoices.

  1. Increase in income disparity because GST will apply to everybody irrelevant of their income level and hence also known as the proportional tax system. So how is the GST going to affect the poor more? To illustrate, we have two individuals, A with an annual income of RM30,000 and B with an annual income of RM80,000.

In a Progressive Tax system A is paying a 5% tax or RM1,250 for his RM25,000 income and B is paying 20% tax or RM16,000 for his RM80,000 income. In this respect the poor man pays only RM1,250 for his taxes while his richer counterpart pays RM16,000 for his taxes.  

In a Proportional Tax system everyone pays the same rate or 15% tax in this case. A with an annual income of RM25,000 will be paying RM3,750 while B with an annual income of RM80,000 will be paying RM12,000.

So, obviously the poor man is going to have less (RM21,250) after the tax deduction whereas the wealthier man still has much left (RM68,000). Similarly, with the implementation of the proportional GST of 6%, who is going to pay more in monetary terms? Will it be the low and middle income or the high income group suffer more?  

  1. Risk of Recession or slowing down of the economy. This will be caused by the Crowding Out effect on the money supply. When our Government raise funds through non-monetize deficit financing activities such as cutting subsidies or broadening the tax receipts through GST, it will have the effect of Crowding Out or displacing the consumer and private business credit. This is because our Government is soaking up the money from the economy, money that would otherwise be used by the consumer to spend and the business to invest. At the end of the day this could reduce both private consumer and business spending and thus will lead to lower economic activity and worsen the recession.   

A good example will be Japan. What happened to Japan’s economy when its Government increased its Consumption Tax from 5% to 8% last year as illustrated by the following?


Japan Sales Tax Rate | Consumption Tax


To cut the story short on what happened to the Japanese economy, I present to you the following GDP growth rate.


Japan GDP Annual Growth Rate

The conclusion is that the Japanese economy went into a recession (2 quarters of – growth) after it increased its consumption tax in the second quarter of 2014.


Our Government should also know that by soaking up money from the existing money supply will lead to lower economic growth and hence might cause a recession. A recession means lower future tax revenue from both the private consumers and businesses. What is our Government going to do next when tax revenues collapse? Increase the GST from 6% to 10% and further rationalising of subsidies? Or further monetize its debts by increasing its borrowings by raising the Debt ceiling?  

  1. Increase in prices. In understanding how taxes affect the prices of goods and services we must understand the two concepts of taxes. Firstly, we must know that taxes impacts the prices of goods and services in two ways namely tax incidence and tax impact. Tax impact refers to the initial point of the tax or the impact on a company or consumer. Tax incidence refers to the final resting place or the burden of the tax where it ended. As for GST the first impression is that it will be levied fairly to everybody since it is proportional. Thus it also gives the impression that the initial impact will be on the companies.

However companies are able to shift the tax burden backwards to the suppliers or forward to the consumers. In economics this is called the shifting thesis. How do they do it? To reduce the impact of GST, companies can shift the tax burden backwards by pressuring suppliers to reduce their prices by a couple of percentage points. With the current slowing economic conditions, I am sure most suppliers are willing to oblige. Thus the initial impact of the GST has already been taken cared because of price reduction from suppliers. Another method to shift the tax burden is to cut wages. Since buying more machinery to automate their operations will have some tax and financial advantages while hiring more people doesn’t give any tax or financial advantages, employers can then threaten employees to accept lower wages or risk being fired. This is because the company can now afford to hire fewer workers by automating their production processes.

Now to shift the tax burden forward to the consumers by increasing the price by 6% or they can reduce the portion (as in F&B).

Hence, in the end the companies will be better off in two ways, first by paying 6% GST on the back end but receive price reduction from suppliers and second from reduced wages and hence more profit. On the front end consumers will be charged higher prices (6% GST) but a smaller portion may be served (as in F&B). The poor consumers will be hit by full brunt of the price increase because they cannot shift their tax burden either forward or backward.        


In wrapping up

At the end of the day it will certainly create two groups of people where one is the recipient while the other is the payer to the state coffer. The group that pays consist of the middle and lower class while the recipients are from the rich whose members include the politicians and their cronies, friends and relatives.

Moving forward I reckoned that the disparities between the rich and poor in Malaysia will be further widened resulting from the GST implementation. This is because further rationalisation of subsidies will be followed by price increase. This will affect the lower and middle income group more due to their inability to shift the tax burden either backward or forward. In the end they will have to absorb further increase in the cost of living.

How the extra funds be utilized?

Finally, how is our Government going to utilize the extra funds to help strengthen the economy? From records, I reckon not much can be expected because we are still going to pay for road tolls, expensive education, inefficient public transport, expensive public utilities and communications. In other words there is no genuine effort to help us reduce our costs of living other than dolling out some money through the Bantuan Rakyat schemes. Again much of the funds will be spent on projects that will benefit their cronies. Such projects also known as mal-investments and some good examples include MAS, Proton, 1MDB, BR1M, KR1M and so on.   

It seems there is not much serious effort being put forward to strengthen our comparative advantage which includes abundant natural resources and labour force, good weather and strategic location (ports). Companies in the past have access to the abundance of cheap labour as it is one of our comparative advantages. However this has almost disappeared because they are now being replaced by cheap foreign labour. Without them many of the products manufactured locally will not be competitive in the Global Market space. We have in fact lost many firsts such as being the largest tin, rubber and now palm oil producer to the rest of the world.

In view of past industrialization efforts, we are yet to produce any ‘Emerging market Multinationals’. A good benchmark on how successful and influential that a company command is getting listed in the Fortune 500 Global Companies. The Fortune 500 Global is the ranking of the top 500 companies around the world as measured by revenue. Throughout the years the only Malaysian company that consistently listed in the Fortune 500 is Petronas. The virtue on why Petronas is listed in the Fortune 500 Global is because it is a GLC or Government-Linked Company. Singapore has two corporations listed in the Fortune Global 500 and they are Flextronics and Wilmar International which is controlled by Malaysian tycoon Robert Kuok. The following is the ranking list of countries with the most Global 500 companies.


China was virtually unrepresented 15 years ago, today has 89 corporations listed and ranked second place. Similarly South Korea whose economy was devastated during the Asian Financial Crisis has 14 corporations listed and ranked 7th  in the world. Other Asian countries that have done pretty well are India, Taiwan and Singapore.

After more than 20 years of industrialization modelled after the Japanese during our ‘Look East’ policy, we have yet to achieve commendable results. Even with the financial and technical assistance provided by the various Government agencies such as MITI (modelled after Japan’s MITI), Sirim, EPU and others, we have yet to produce any world class companies. So, I reckon our Government owe us some explanations to the following questions:

  1. How are we going to address our widening income disparity?
  2. Are we doing anything to make our economy more sustainable?
  3. Are we doing anything to address the current issue in our education system where science and mathematics are not given top priorities?     
  4. What steps being taken to enable us to move up the competitive ladder?
  5. How about issues on equal opportunity and corruption?
  6. Are we doing anything to capitalize on the Chinese and Indian diaspora to help us build our economy as what happened in China and India? China’s current achievement being the ‘World Manufacturing hub’ and India’s reputation being the ‘World Service Centre’ are made possible due to the contribution of their overseas Chinese and Indians.
  7. When are we going to stop discriminating other races from holding top positions in GLCs and the Government? As Deng Xiaoping quoted “it doesn’t matter whether the cat is white or black as long as it catches the mice”
  8. Why Malaysia as a resource rich country is doing worse than countries like Singapore, Hong Kong, Taiwan, and Switzerland that have no natural resources?
  9. How about our Talent development? Any idea where are we heading in the next 10, 20 or 30 years from now?


As long as no efforts are taken to address the above fundamental problems, it will be a herculean task to take our economy to the next level to compete with the rest. Despite the many corridors and hubs that have been implemented, we have yet to attract many Global technology companies to invest and create a critical mass in our Research and Development. This is because we are under funding our research in physical sciences and thus lagged publications in these areas. Our politicians have yet given a thought on what Malaysia want to be in the next twenty to fifty years. Reason being our politicians haven’t “Get it” as those politicians in China and India. Many of their top officials are trained engineers and they ‘Get it’ because they understand the linkages between technology development to manufacturing, university and infrastructure Eco-system.

We seriously need another Economic Blueprint that will help put Malaysia into the Economic World Map. One way of doing it is to design another Economic Blueprint that will help Malaysia achieve broad-based sustainable development. That includes improvement in governance, environment and most importantly more equitable distribution of income among women, minorities and other disadvantaged groups. When we achieved sustainable development in the above three components of the economy, then broad-based economic development will automatically followed. This is because only then our growing economy will be able to constantly transform itself to meet new challenges and hence achieve a higher standard of living.

Sunday, December 21, 2014

Will the Malaysian Economy Risk another Financial Crisis in 2015?


If any of you can remember for the past few months our government has been engaging on a propaganda spree claiming that our economy is doing excellent and our budget deficit is on track hitting the 3% target. In addition it is also reported that our household sector is supported by sustained income growth and hence consumption. Our high level of international reserves, current account surplus, resilient domestic financial system and low level of external debt helps reinforce the strength of our economy. Bank Negara even forecast a GDP growth between 5.0 to 5.5% for fiscal 2015? Is our economy really that resilient and solid? This article aims to dissect the reported facts above and also at the same time gauge the performance of the Malaysian economy.

External Debt.

From 1990 to 2013, Malaysia’s external debt averages about RM 43 billion but somehow as of the 2nd quarter of 2014 it exploded to RM 740 billion (Chart shown below). This represents an astonishing further 17x leverage in the past year. I do not know have the breakdown on where are those funds headed to but I suspect some might have gone to 1MDB or One Malaysia Development Berhad, another Malaysia Sovereign Wealth Fund. Getting highly geared during such challenging economic times is not only unwise but suicidal especially when you are on the wrong side of the fence. This is because our Ringgit has been depreciating sharply recently. I shall go into details next on why we are in trouble when leveraged with foreign money no matter what currency it is denominated in.


Malaysia External Debt


Due to the near zero interest rate policy in the West and the excess supply of funds available, naturally money will always go to the place where it is best treated. Hence as a result there was a frantic search for a higher yield debt market. There is no better place than Asia because Asia offers one of the safer and higher yield market. Consequently, there was a huge inflow of funds especially from Europe to Asia since 2009. This can be shown by the following chart.

http://www.theautomaticearth.com/wp-content/uploads/2014/12/EmergingMarketCorporateDebt.jpg

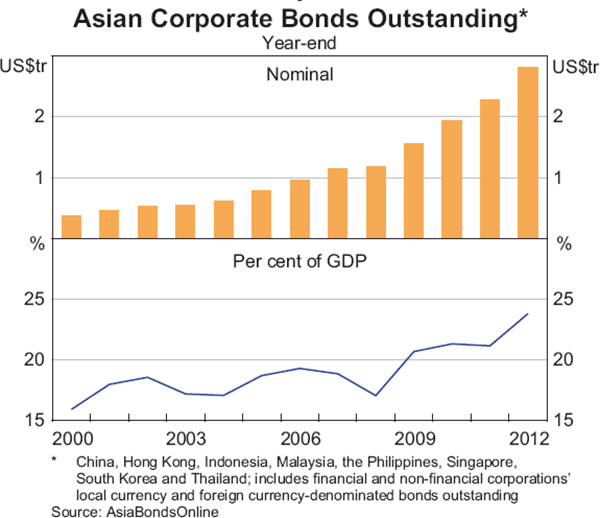
As seen, the emerging market corporate debt market has grown more than 400% since 2008 and is still growing. One reason for the massive increase is the growth of the corporate bond market. Instead of relying on the traditional bank financing, more corporations are looking into non-bank financing options which also offers a cheaper solution. As a result the corporate bond market in Asia has grown tremendously in recent years. This can be demonstrated by the following graph. Total outstanding debts in bond are worth about USD 2.6 trillion. This is huge and a time bomb waiting to explode.


http://www.rba.gov.au/publications/bulletin/2013/sep/images/graph-0913-7-01.gif


So how big is Malaysia’s Bond market? The following chart best depicts the size of our bond market. Malaysia’s bond market is one of the biggest in Asia (about 50% to GDP) due to the fact that Malaysia can be said to be the center for issuing and trading Islamic bonds.

http://www.rba.gov.au/publications/bulletin/2013/sep/images/graph-0913-7-02.gif

So what are the risks of having a large portion of debts denominated in bonds? Firstly since bond is a form of debt and any debts that are leverage to the hilt always poses a danger. If the bonds are denominated in USD then there is always the danger of exposing to the risk of ‘Foreign Exchange Exposure’. Foreign exchange exposure refers to a situation where you are exposed to the ups and down (volatility) of the foreign currency the loan is denominated.

For example, if a corporate had raised USD 10 million from the bond market in 2012 with the prevailing exchange rate of 3.10. Putting aside the interest rate, total debt payable converted to Malaysian Ringgit shall be RM 31 million. What happens when our Ringgit depreciates against the Dollar like what is happening now? With the current exchange rate of 3.46, the principal amount payable will increase to RM 34.6 million. Hence, there is a foreign exchange loss of RM 3.6 million. However, this risk can be reduced through hedging using tools like Currency Options, Currency Futures or Currency Forward Contracts. However I doubt it if there are many corporate borrowers hedged their foreign currency exposures due to the high costs associated with it.   

What happen when the bonds are denominated in local currency or Ringgit? Well foreign bond holders will be on the losing side. This is because when they exit the bond market they will be getting less USD when they convert their Ringgit to the USD. To ensure the bondholders do not exit at the same time, interest rates will have to increase as a form of compensation. This is because the price of bonds relates inversely with the yield. When they start selling, the price of bonds will go down but the yield will go up. The risk is when every bondholders start rushing for the exit, this will cause a meltdown in the bond market.

Depreciating Ringgit.

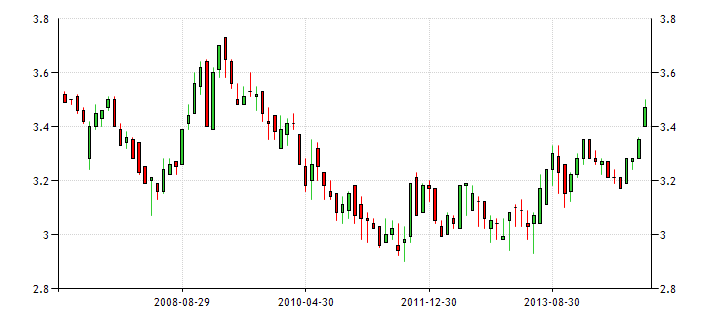
As we have known our Ringgit has been on the downtrend since last year only recuperating some losses beginning of this year. However the slide begins again and it looks like we are yet to see the worse. The following chart denotes the exchange rate between the USD and our Ringgit. As can be seen it is now fast approaching the 3.70 level that was set back in 2009 during the Global Financial Crisis.
USD/MYR chart

Historical Data Chart

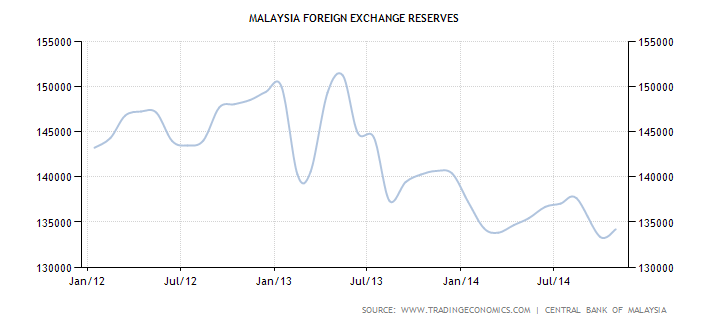
Similar to the Bank of Indonesia’s intervention into the Rupiah on 17/12/2014 to prevent it from sliding below the 2008 level, Bank Negara Malaysia has also been involve in the intervention of the Malaysian Ringgit through open market operation by selling the Dollar to prevent further slide of the Ringgit. This can be shown by the sharp decline of our Foreign Exchange Reserves in the following chart.

Historical Data Chart

From the chart above, our Foreign Exchange Reserves peaked at $155 billion in August 2011 but has since been declining rapidly. In October our Foreign Reserves stood at $134 billion, a drop of $21 billion from the peak. We have been recording Balance of Payment surplus for the past many years and by right the excess Dollars should be added into the Foreign Exchange Reserves. Yet we are seeing dwindling reserves and one explanation will be some of the reserves are being used for open market operations to support the Ringgit.

Similar to a fall in oil price, a fall in the Ringgit will have both negative and positive effects. Positive effects includes more exports hence more foreign currency receipts and negative effects include higher import costs and hence higher inflation.

As already mentioned above, one of the major side effects of the appreciation of the Dollar will be exiting by foreign bondholders and hence the repatriation of the Dollar. The Federal Reserve has already started tapering and eventually this will lead to a Dollar liquidity crunch. To overcome this imbalance, funds will have to be redirected from elsewhere. The Dollar Liquidity Crunch caused by tapering will ultimately lead to an interest rate hike soon. When interest rates are hike, it will attract more Dollars from abroad and this will further strengthen the Dollar. In a way this will cause a feedback loop whereby the faster the U.S economy recovers then the higher the U.S Dollar appreciates. This spells trouble for countries sitting on the wrong side of the fence (having huge foreign debts). The following Dollar index chart shows how fast the Dollar appreciates in the last few months.

http://stockcharts.com/c-sc/sc?s=%21USD&p=D&yr=1&mn=0&dy=0&i=t88045255728&r=1419129831946

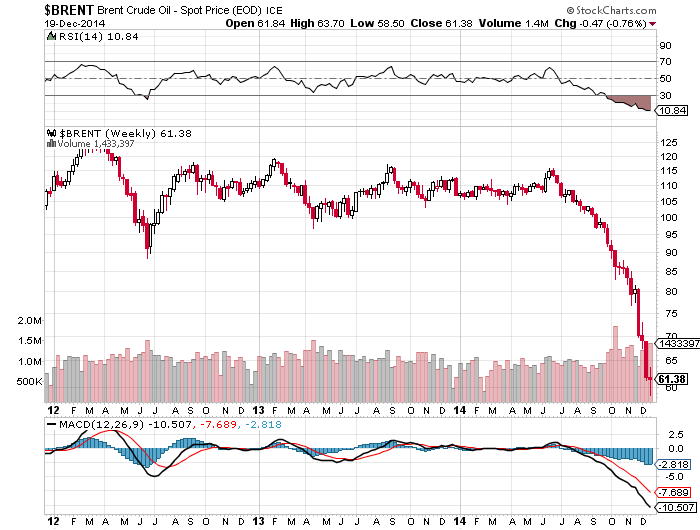
Notice that the Dollar started to appreciate in July when it moved above the Moving Average 50 and 200 days. Not only that if you take a look at the Brent Crude Oil chart below,  the price of crude oil also started to drop n July. What this tells us is that there exist a correlation between the price of oil and the Dollar. As I have indicated above, the Dollar is expected to keep strengthening due to the Dollar liquidity crunch and interest rate hike. This means that the price of oil will have problem moving higher as long as the value of the Dollar remains high.


http://stockcharts.com/c-sc/sc?s=$BRENT&p=W&yr=3&mn=0&dy=0&i=t80355308143&r=1419071704183

But the peculiar thing is that even when our Ringgit is falling, our exports volume declined as compared to import volume recently. Why is this happening? I will try to address the problem below on why our exports are declining.  


Declining competitiveness

Balance of Trade or trade balance is the difference between a country’s exports and imports. A country is experiencing a deficit when imports exceed exports. Likewise a surplus will be the reverse. Malaysia recorded a trade surplus of only RM 1.186 billion in the month of October 2014. This represents a sharp decline as compared to a surplus of RM8.23 billion in October 2013. This has due to the increased in import by 9.1% and a fall in exports by 3.1% (RM 67.19 billion in Oct 2013 and RM 65.1 billion in Oct 2014) during that period of time.
From below our current trade balance has recorded one of the worst readings for the past 10 years. Again from the Currency chart above, even when our ringgit was trading at the lowest (USD/MYR = 3.70) in 2009, we recorded one of the highest positive trade balance of RM 16 billion. So what caused our exports to decline?

Historical Data Chart

There are two reasons attributed to this conundrum. One might be that our Ringgit has not been depreciated as drastically as other currencies. For example the Indonesian Rupiah depreciated to a low of 12,725 to the Dollar on 14/12/2014 which was lower than the level set back in 2008. Thus, this made Indonesian exports like Rubber, Palm oil and other commodities cheaper than Malaysia, hence contributed to our decline in exports.

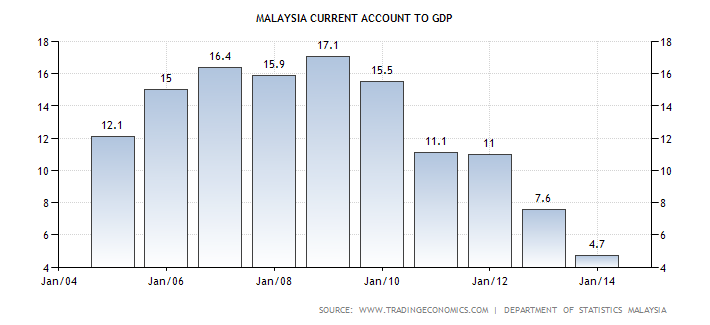
The other more important factor is our declining level of competitiveness. Although our authorities claimed that our country is getting more competitive in the international arena but statistically it proved otherwise. A good statistical tool to demonstrate the competitiveness of a country will be the Current Account (CA) to GDP. If a country exhibits a strong CA/GDP then it is consider very competitive because of its strong exports. Likewise if a country is experiencing a low CA/GDP reading then its competitiveness is deteriorating due to declining exports.


Malaysia Current Account to GDP

As shown above Malaysia’s CA/GDP has been on the decline since 2008 and recently recorded the lowest for the past 10 years. In 2013, our economy recorded a 4.7% reading in the ratio. So what are we going to do to reverse the trend? I reckon it is best to leave it to our experts in the government.


Declining Oil Revenue

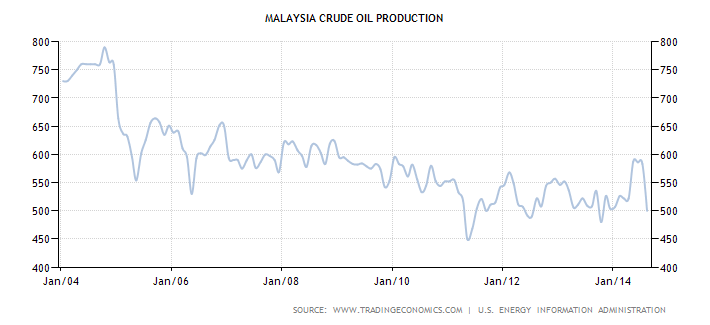
Malaysia has been experiencing a steady decline in its crude oil production. Production peaked in October 2004 with 790,000 barrels per day. This can be shown by the chart below.


Historical Data Chart

The price of crude oil has been holding above the $100 for about 43 months before it began to slide downwards in July this year. The recent fast and huge decline in oil price is also known as the Mega Oil Price Crash. This extent of the carnage can be shown by the chart below.  


http://stockcharts.com/c-sc/sc?s=$BRENT&p=W&yr=3&mn=0&dy=0&i=t80355308143&r=1419071704183


What are ramifications to our economy when oil price crashed?

  1. Less oil revenue received. Based from the above data, we can calculate the approximate loss of revenue from our oil exports. With the following assumption.

July pricing = $110 per barrel
December pricing = $ 61.38
Daily Oil Output = 550,000 barrels a day. Averaged from Jan – Dec 2014.
USD/MYR as of December 19 2014 = 3.476

Revenue as per July 2014.

550,000 barrels/day x $110 = $60.5 million per day

Revenue as per December 2014

550,000 barrels/day x $61.38 = $33.75 million per day

So, the loss of revenue per day = $69.75m - $33.75m = $26.75m

Per year loss of revenue = $26.75 x 365 = $9.763 billion x 3,476 = RM 33.94 billion.

Even with the recent complete removal of fuel subsidies which amounts to about 2.3% of GDP, it still not enough to cover the loss in revenue.


http://ftalphaville.ft.com/files/2012/10/EMGovtenergySubsidies_CE.png


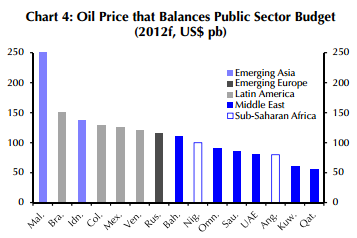
Malaysia cannot expect to use its oil revenue to balance its budget due to its high budget deficit and also being a relatively small oil exporter. According to the chart below, we needed more than $200 in oil price to balance our budget.

http://ftalphaville.ft.com/files/2012/10/EMGovtBreakevenCrudeprice_CE.png


According to IEA the price of oil should be trading between $60 to $70 from 2015 to 2016 due to demand weakness plus additional fresh supply of 2.5 million barrels per day coming from the Gorgon field in Australia, Kashagan field in Kazakhstan and also the Angolan and Columbian fields in 2016.  

Apart from the shale boom in the U.S, other factors affecting the demand for oil is not only the advancement battery technologies but also increased financial commitment by Governments to develop EV technologies. Germany and China has both $Billions to jumpstart their research and development transition into EVs or Electric Vehicles.

Dramatic development in battery technology resulted in higher efficiency, has been made possible by companies like SeeO and Sakhti. Another recent breakthrough in battery technology using titanium was developed by the Nanyang Technology University of Singapore. The battery is made from titanium dioxide and can last up to 20 years. This enables ultra-fast charging for batteries, recharging up to 70% in 2 minutes. Electric vehicles can now be charged within minutes and can go faster and further due to the lesser weight of the batteries. So with all these developments, it will be a challenge for oil price to remain above $70 in the future.  

Further to this, there is no rush for OPEC to cut production and risked losing customers because they can now afford lower price to balance their budget. To show you how they can now afford lower prices to balance their public budget, I shall use Nigeria as an example. As from the above Nigeria needed about $100 to balance its public budget will now only need about $88. This is because the USD has appreciated more than 12% since July 2014. Thus, if the USD continues to rise then oil exporting countries can live with lower oil price because any revenue loss from lower price will be compensated by the gain in the USD.


Balancing Budget

Malaysian Prime Minister Najib Razak said that we are on track to shrink our budget deficit down to 3% from the current 3.9%. See below.


Malaysia Government Budget


Can he do it? Looking at the global economic scenario developing at the moment I reckon it is very difficult if not impossible to achieve the target.
Firstly Malaysia is an oil exporter nation and hence its oil revenue will be subjected to the volatility of the global oil price. When oil price was above $100 it is very likely we can achieve the deficit target given the recent complete fuel subsidy removal and the intended implementation of GST April next year. Given the recent mega oil price crash that has taken everyone by surprise, the equation on balancing budget has certainly changed. Below is the table that shows the impact of a $10 reduction in oil price on GDP growth.

http://media.tumblr.com/811adbee68fd053b253fe9dde996b9f7/tumblr_inline_ng8v41QlN41t421e7.jpg
           Source : Business Insider


As can be seen from above, a $10 reduction in oil price will slice of 0.2% from Malaysia’s GDP growth. If the current oil price stays at around $60 - $70, then our next GDP growth next year will be reduced by at least 0.6%.
Secondly, balancing a budget requires more than cutting down government expenses and increasing income as can be shown below. For a full picture we need to bring in the Balance of Payment because of its relationship with the national income or GDP. Thus,
GDP or the National Income (Y) can be defined as follows.

GDP = Y = C + I + G + (X - M)
Where,
C = Consumption
I = Investment
G = Government Expenditure
X = Exports
M = Imports

When we introduce Savings (S) into the equation then it will be different picture. Savings can be defined as the amount left from the National Income (GDP) after deducting Consumption (C) and Taxes (T). Hence,

S = Y – (C – T) or can be written as below
S = C + I + G + (X – M) – (C – T)
Now from Balance of Payment definition (X – M) = BCA (Balance of Current Account)
After netting off the Consumption or C, the equation can be re-written as follows.
(S – I) + (T – G) = (X – M) = BCA
(T – G) = (X – M) – (S – I)
Thus from above we can see that for the budget deficit (T – G) to reduce, either (S – I) or (X – M) has to increase. Or,
X > M  or,
S > I

The following shows our savings rate which have been on the decline since 2002.


 Malaysia Savings Rate
 malaysia gross domestic savings percent of gdp wb data


Thus by assembling all the data above we can derive the performance of the different economic indicators and the results can be summarized as follows.

↑ M , ↓ X , ↑I and ↓ S

So how can we reduce our budget deficit when our economic indicators moved in different directions? One way to do it is to massively increase the taxation income and drastically cut back on government spending. Unfortunately both are not the best option at the moment. If both are not practical then we will have to resort to borrowing from external sources. Hence, this helps explain why our External Debt has grown from RM43 billion to RM740 billion.


Wrapping Up

In wrapping, from above and going through the complete cycle you notice that not all is about oil, it has much more to do with the USD. The current turmoil in the oil market has benefited the USD by regaining some relevance as the reserve and trading currency.
According to the IEA, currently there exists an excess supply of about 2 million barrels a day that caused the current dampening oil prices. The funny thing is that if there exist an oversupply for years, why has the oil price managed to stay above the $100 level for more than 43 months.
Another argument is that oil price can resume back above $100 in no time if the American Government decides to soak up the extra supply into its strategic reserve. By adding the extra 2 million barrels a day to its strategic stockpile, it only cost the American Government about $77 million a day ($100-$61.38 x 2 million barrels). That works out to be about $2.31 billion in a month. What is $2.3 billion when compared to the monthly injection of $85 billion into the economy by way of Quantitative Easing?
Hence, the BIG picture is all about the USD. It is the main threat to the emerging markets as their exposure to external debts amounts to $5.7 trillion. Out of that $3.1 trillion are in bank loans and $2.6 trillion in bonds. If the U.S continues to pursue Exchange Rate Stability then the rise in the USD will certainly increase the risk of credit default in emerging markets. The question is how long can the emerging markets sustain their pain threshold? If there is another black swan event causing Western lenders to recall their loans and exiting the door at the same time, then emerging markets currency will faced meltdown and hence causing another Financial Crisis.  


The author is the Economic Advisor to The National Union of Bank Employees