Sunday, December 21, 2014

Will the Malaysian Economy Risk another Financial Crisis in 2015?


If any of you can remember for the past few months our government has been engaging on a propaganda spree claiming that our economy is doing excellent and our budget deficit is on track hitting the 3% target. In addition it is also reported that our household sector is supported by sustained income growth and hence consumption. Our high level of international reserves, current account surplus, resilient domestic financial system and low level of external debt helps reinforce the strength of our economy. Bank Negara even forecast a GDP growth between 5.0 to 5.5% for fiscal 2015? Is our economy really that resilient and solid? This article aims to dissect the reported facts above and also at the same time gauge the performance of the Malaysian economy.

External Debt.

From 1990 to 2013, Malaysia’s external debt averages about RM 43 billion but somehow as of the 2nd quarter of 2014 it exploded to RM 740 billion (Chart shown below). This represents an astonishing further 17x leverage in the past year. I do not know have the breakdown on where are those funds headed to but I suspect some might have gone to 1MDB or One Malaysia Development Berhad, another Malaysia Sovereign Wealth Fund. Getting highly geared during such challenging economic times is not only unwise but suicidal especially when you are on the wrong side of the fence. This is because our Ringgit has been depreciating sharply recently. I shall go into details next on why we are in trouble when leveraged with foreign money no matter what currency it is denominated in.


Malaysia External Debt


Due to the near zero interest rate policy in the West and the excess supply of funds available, naturally money will always go to the place where it is best treated. Hence as a result there was a frantic search for a higher yield debt market. There is no better place than Asia because Asia offers one of the safer and higher yield market. Consequently, there was a huge inflow of funds especially from Europe to Asia since 2009. This can be shown by the following chart.

http://www.theautomaticearth.com/wp-content/uploads/2014/12/EmergingMarketCorporateDebt.jpg

As seen, the emerging market corporate debt market has grown more than 400% since 2008 and is still growing. One reason for the massive increase is the growth of the corporate bond market. Instead of relying on the traditional bank financing, more corporations are looking into non-bank financing options which also offers a cheaper solution. As a result the corporate bond market in Asia has grown tremendously in recent years. This can be demonstrated by the following graph. Total outstanding debts in bond are worth about USD 2.6 trillion. This is huge and a time bomb waiting to explode.


http://www.rba.gov.au/publications/bulletin/2013/sep/images/graph-0913-7-01.gif


So how big is Malaysia’s Bond market? The following chart best depicts the size of our bond market. Malaysia’s bond market is one of the biggest in Asia (about 50% to GDP) due to the fact that Malaysia can be said to be the center for issuing and trading Islamic bonds.

http://www.rba.gov.au/publications/bulletin/2013/sep/images/graph-0913-7-02.gif

So what are the risks of having a large portion of debts denominated in bonds? Firstly since bond is a form of debt and any debts that are leverage to the hilt always poses a danger. If the bonds are denominated in USD then there is always the danger of exposing to the risk of ‘Foreign Exchange Exposure’. Foreign exchange exposure refers to a situation where you are exposed to the ups and down (volatility) of the foreign currency the loan is denominated.

For example, if a corporate had raised USD 10 million from the bond market in 2012 with the prevailing exchange rate of 3.10. Putting aside the interest rate, total debt payable converted to Malaysian Ringgit shall be RM 31 million. What happens when our Ringgit depreciates against the Dollar like what is happening now? With the current exchange rate of 3.46, the principal amount payable will increase to RM 34.6 million. Hence, there is a foreign exchange loss of RM 3.6 million. However, this risk can be reduced through hedging using tools like Currency Options, Currency Futures or Currency Forward Contracts. However I doubt it if there are many corporate borrowers hedged their foreign currency exposures due to the high costs associated with it.   

What happen when the bonds are denominated in local currency or Ringgit? Well foreign bond holders will be on the losing side. This is because when they exit the bond market they will be getting less USD when they convert their Ringgit to the USD. To ensure the bondholders do not exit at the same time, interest rates will have to increase as a form of compensation. This is because the price of bonds relates inversely with the yield. When they start selling, the price of bonds will go down but the yield will go up. The risk is when every bondholders start rushing for the exit, this will cause a meltdown in the bond market.

Depreciating Ringgit.

As we have known our Ringgit has been on the downtrend since last year only recuperating some losses beginning of this year. However the slide begins again and it looks like we are yet to see the worse. The following chart denotes the exchange rate between the USD and our Ringgit. As can be seen it is now fast approaching the 3.70 level that was set back in 2009 during the Global Financial Crisis.
USD/MYR chart

Historical Data Chart

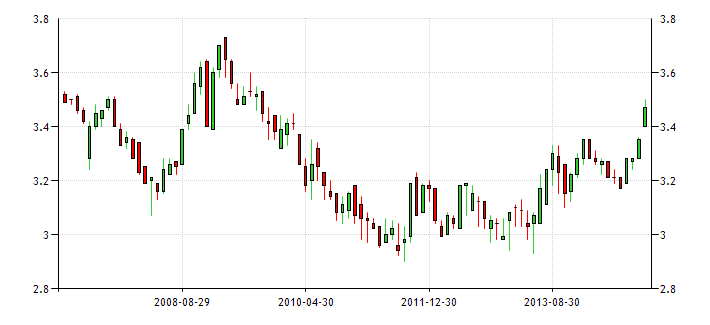
Similar to the Bank of Indonesia’s intervention into the Rupiah on 17/12/2014 to prevent it from sliding below the 2008 level, Bank Negara Malaysia has also been involve in the intervention of the Malaysian Ringgit through open market operation by selling the Dollar to prevent further slide of the Ringgit. This can be shown by the sharp decline of our Foreign Exchange Reserves in the following chart.

Historical Data Chart

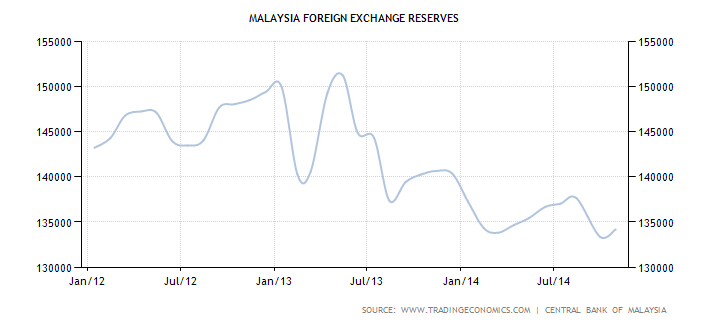
From the chart above, our Foreign Exchange Reserves peaked at $155 billion in August 2011 but has since been declining rapidly. In October our Foreign Reserves stood at $134 billion, a drop of $21 billion from the peak. We have been recording Balance of Payment surplus for the past many years and by right the excess Dollars should be added into the Foreign Exchange Reserves. Yet we are seeing dwindling reserves and one explanation will be some of the reserves are being used for open market operations to support the Ringgit.

Similar to a fall in oil price, a fall in the Ringgit will have both negative and positive effects. Positive effects includes more exports hence more foreign currency receipts and negative effects include higher import costs and hence higher inflation.

As already mentioned above, one of the major side effects of the appreciation of the Dollar will be exiting by foreign bondholders and hence the repatriation of the Dollar. The Federal Reserve has already started tapering and eventually this will lead to a Dollar liquidity crunch. To overcome this imbalance, funds will have to be redirected from elsewhere. The Dollar Liquidity Crunch caused by tapering will ultimately lead to an interest rate hike soon. When interest rates are hike, it will attract more Dollars from abroad and this will further strengthen the Dollar. In a way this will cause a feedback loop whereby the faster the U.S economy recovers then the higher the U.S Dollar appreciates. This spells trouble for countries sitting on the wrong side of the fence (having huge foreign debts). The following Dollar index chart shows how fast the Dollar appreciates in the last few months.

http://stockcharts.com/c-sc/sc?s=%21USD&p=D&yr=1&mn=0&dy=0&i=t88045255728&r=1419129831946

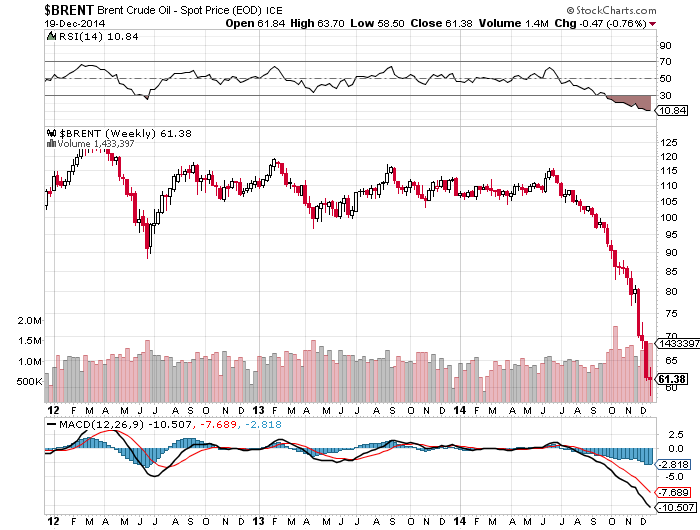
Notice that the Dollar started to appreciate in July when it moved above the Moving Average 50 and 200 days. Not only that if you take a look at the Brent Crude Oil chart below,  the price of crude oil also started to drop n July. What this tells us is that there exist a correlation between the price of oil and the Dollar. As I have indicated above, the Dollar is expected to keep strengthening due to the Dollar liquidity crunch and interest rate hike. This means that the price of oil will have problem moving higher as long as the value of the Dollar remains high.


http://stockcharts.com/c-sc/sc?s=$BRENT&p=W&yr=3&mn=0&dy=0&i=t80355308143&r=1419071704183

But the peculiar thing is that even when our Ringgit is falling, our exports volume declined as compared to import volume recently. Why is this happening? I will try to address the problem below on why our exports are declining.  


Declining competitiveness

Balance of Trade or trade balance is the difference between a country’s exports and imports. A country is experiencing a deficit when imports exceed exports. Likewise a surplus will be the reverse. Malaysia recorded a trade surplus of only RM 1.186 billion in the month of October 2014. This represents a sharp decline as compared to a surplus of RM8.23 billion in October 2013. This has due to the increased in import by 9.1% and a fall in exports by 3.1% (RM 67.19 billion in Oct 2013 and RM 65.1 billion in Oct 2014) during that period of time.
From below our current trade balance has recorded one of the worst readings for the past 10 years. Again from the Currency chart above, even when our ringgit was trading at the lowest (USD/MYR = 3.70) in 2009, we recorded one of the highest positive trade balance of RM 16 billion. So what caused our exports to decline?

Historical Data Chart

There are two reasons attributed to this conundrum. One might be that our Ringgit has not been depreciated as drastically as other currencies. For example the Indonesian Rupiah depreciated to a low of 12,725 to the Dollar on 14/12/2014 which was lower than the level set back in 2008. Thus, this made Indonesian exports like Rubber, Palm oil and other commodities cheaper than Malaysia, hence contributed to our decline in exports.

The other more important factor is our declining level of competitiveness. Although our authorities claimed that our country is getting more competitive in the international arena but statistically it proved otherwise. A good statistical tool to demonstrate the competitiveness of a country will be the Current Account (CA) to GDP. If a country exhibits a strong CA/GDP then it is consider very competitive because of its strong exports. Likewise if a country is experiencing a low CA/GDP reading then its competitiveness is deteriorating due to declining exports.


Malaysia Current Account to GDP

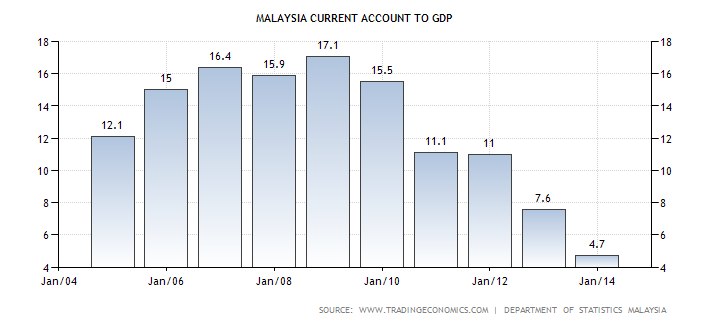
As shown above Malaysia’s CA/GDP has been on the decline since 2008 and recently recorded the lowest for the past 10 years. In 2013, our economy recorded a 4.7% reading in the ratio. So what are we going to do to reverse the trend? I reckon it is best to leave it to our experts in the government.


Declining Oil Revenue

Malaysia has been experiencing a steady decline in its crude oil production. Production peaked in October 2004 with 790,000 barrels per day. This can be shown by the chart below.


Historical Data Chart

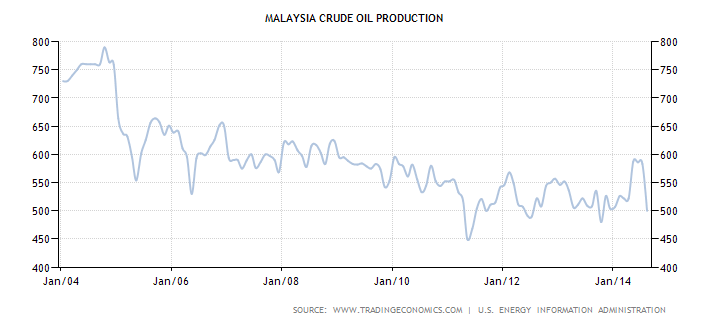
The price of crude oil has been holding above the $100 for about 43 months before it began to slide downwards in July this year. The recent fast and huge decline in oil price is also known as the Mega Oil Price Crash. This extent of the carnage can be shown by the chart below.  


http://stockcharts.com/c-sc/sc?s=$BRENT&p=W&yr=3&mn=0&dy=0&i=t80355308143&r=1419071704183


What are ramifications to our economy when oil price crashed?

  1. Less oil revenue received. Based from the above data, we can calculate the approximate loss of revenue from our oil exports. With the following assumption.

July pricing = $110 per barrel
December pricing = $ 61.38
Daily Oil Output = 550,000 barrels a day. Averaged from Jan – Dec 2014.
USD/MYR as of December 19 2014 = 3.476

Revenue as per July 2014.

550,000 barrels/day x $110 = $60.5 million per day

Revenue as per December 2014

550,000 barrels/day x $61.38 = $33.75 million per day

So, the loss of revenue per day = $69.75m - $33.75m = $26.75m

Per year loss of revenue = $26.75 x 365 = $9.763 billion x 3,476 = RM 33.94 billion.

Even with the recent complete removal of fuel subsidies which amounts to about 2.3% of GDP, it still not enough to cover the loss in revenue.


http://ftalphaville.ft.com/files/2012/10/EMGovtenergySubsidies_CE.png


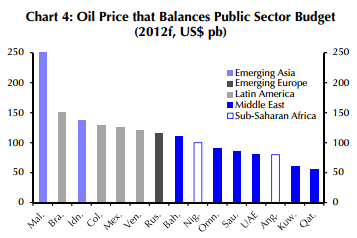
Malaysia cannot expect to use its oil revenue to balance its budget due to its high budget deficit and also being a relatively small oil exporter. According to the chart below, we needed more than $200 in oil price to balance our budget.

http://ftalphaville.ft.com/files/2012/10/EMGovtBreakevenCrudeprice_CE.png


According to IEA the price of oil should be trading between $60 to $70 from 2015 to 2016 due to demand weakness plus additional fresh supply of 2.5 million barrels per day coming from the Gorgon field in Australia, Kashagan field in Kazakhstan and also the Angolan and Columbian fields in 2016.  

Apart from the shale boom in the U.S, other factors affecting the demand for oil is not only the advancement battery technologies but also increased financial commitment by Governments to develop EV technologies. Germany and China has both $Billions to jumpstart their research and development transition into EVs or Electric Vehicles.

Dramatic development in battery technology resulted in higher efficiency, has been made possible by companies like SeeO and Sakhti. Another recent breakthrough in battery technology using titanium was developed by the Nanyang Technology University of Singapore. The battery is made from titanium dioxide and can last up to 20 years. This enables ultra-fast charging for batteries, recharging up to 70% in 2 minutes. Electric vehicles can now be charged within minutes and can go faster and further due to the lesser weight of the batteries. So with all these developments, it will be a challenge for oil price to remain above $70 in the future.  

Further to this, there is no rush for OPEC to cut production and risked losing customers because they can now afford lower price to balance their budget. To show you how they can now afford lower prices to balance their public budget, I shall use Nigeria as an example. As from the above Nigeria needed about $100 to balance its public budget will now only need about $88. This is because the USD has appreciated more than 12% since July 2014. Thus, if the USD continues to rise then oil exporting countries can live with lower oil price because any revenue loss from lower price will be compensated by the gain in the USD.
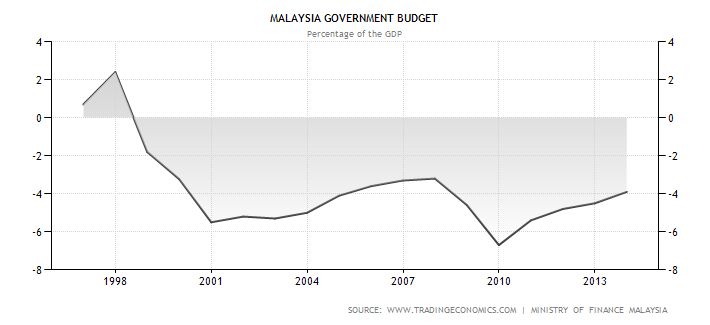

Balancing Budget

Malaysian Prime Minister Najib Razak said that we are on track to shrink our budget deficit down to 3% from the current 3.9%. See below.


Malaysia Government Budget


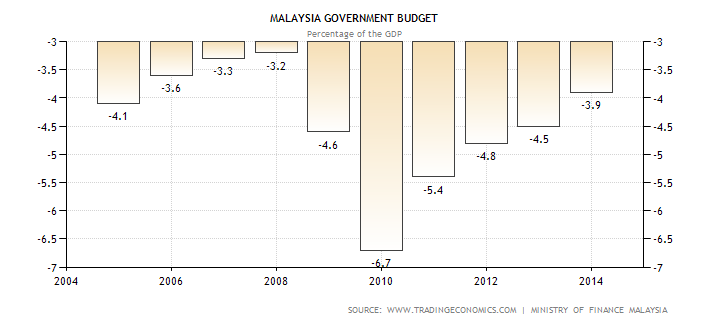
Can he do it? Looking at the global economic scenario developing at the moment I reckon it is very difficult if not impossible to achieve the target.
Firstly Malaysia is an oil exporter nation and hence its oil revenue will be subjected to the volatility of the global oil price. When oil price was above $100 it is very likely we can achieve the deficit target given the recent complete fuel subsidy removal and the intended implementation of GST April next year. Given the recent mega oil price crash that has taken everyone by surprise, the equation on balancing budget has certainly changed. Below is the table that shows the impact of a $10 reduction in oil price on GDP growth.

http://media.tumblr.com/811adbee68fd053b253fe9dde996b9f7/tumblr_inline_ng8v41QlN41t421e7.jpg
           Source : Business Insider


As can be seen from above, a $10 reduction in oil price will slice of 0.2% from Malaysia’s GDP growth. If the current oil price stays at around $60 - $70, then our next GDP growth next year will be reduced by at least 0.6%.
Secondly, balancing a budget requires more than cutting down government expenses and increasing income as can be shown below. For a full picture we need to bring in the Balance of Payment because of its relationship with the national income or GDP. Thus,
GDP or the National Income (Y) can be defined as follows.

GDP = Y = C + I + G + (X - M)
Where,
C = Consumption
I = Investment
G = Government Expenditure
X = Exports
M = Imports

When we introduce Savings (S) into the equation then it will be different picture. Savings can be defined as the amount left from the National Income (GDP) after deducting Consumption (C) and Taxes (T). Hence,

S = Y – (C – T) or can be written as below
S = C + I + G + (X – M) – (C – T)
Now from Balance of Payment definition (X – M) = BCA (Balance of Current Account)
After netting off the Consumption or C, the equation can be re-written as follows.
(S – I) + (T – G) = (X – M) = BCA
(T – G) = (X – M) – (S – I)
Thus from above we can see that for the budget deficit (T – G) to reduce, either (S – I) or (X – M) has to increase. Or,
X > M  or,
S > I

The following shows our savings rate which have been on the decline since 2002.


 Malaysia Savings Rate
 malaysia gross domestic savings percent of gdp wb data


Thus by assembling all the data above we can derive the performance of the different economic indicators and the results can be summarized as follows.

↑ M , ↓ X , ↑I and ↓ S

So how can we reduce our budget deficit when our economic indicators moved in different directions? One way to do it is to massively increase the taxation income and drastically cut back on government spending. Unfortunately both are not the best option at the moment. If both are not practical then we will have to resort to borrowing from external sources. Hence, this helps explain why our External Debt has grown from RM43 billion to RM740 billion.


Wrapping Up

In wrapping, from above and going through the complete cycle you notice that not all is about oil, it has much more to do with the USD. The current turmoil in the oil market has benefited the USD by regaining some relevance as the reserve and trading currency.
According to the IEA, currently there exists an excess supply of about 2 million barrels a day that caused the current dampening oil prices. The funny thing is that if there exist an oversupply for years, why has the oil price managed to stay above the $100 level for more than 43 months.
Another argument is that oil price can resume back above $100 in no time if the American Government decides to soak up the extra supply into its strategic reserve. By adding the extra 2 million barrels a day to its strategic stockpile, it only cost the American Government about $77 million a day ($100-$61.38 x 2 million barrels). That works out to be about $2.31 billion in a month. What is $2.3 billion when compared to the monthly injection of $85 billion into the economy by way of Quantitative Easing?
Hence, the BIG picture is all about the USD. It is the main threat to the emerging markets as their exposure to external debts amounts to $5.7 trillion. Out of that $3.1 trillion are in bank loans and $2.6 trillion in bonds. If the U.S continues to pursue Exchange Rate Stability then the rise in the USD will certainly increase the risk of credit default in emerging markets. The question is how long can the emerging markets sustain their pain threshold? If there is another black swan event causing Western lenders to recall their loans and exiting the door at the same time, then emerging markets currency will faced meltdown and hence causing another Financial Crisis.  


The author is the Economic Advisor to The National Union of Bank Employees


Thursday, November 20, 2014

Malaysia's Subsidy and Budget Deficit Conundrum

In reality, running a Government is similar to running a company in many respects. Both have revenues and spending to adhere to. When a Government runs a deficit then it needs to sell Treasury bills, notes and bonds to raise funds. Similarly when a company is short of cash, it can raise funds by selling securities. In a way it can be said that the total debt incurred by the Government is the total outstanding government securities. Thus the total or national debt at any point of time is the sum of all prior deficits. Hence, when a Government runs a deficit, the national debt will be increased by the amount of the deficit.

Why do Government run deficits? One good reason is that it spends more than the revenue it collects because it did not exercise fiscal restraint or spend prudently in layman’s term. Another reason might be the decrease in tax revenue collection. When an economy contracts the deficit is likely to increase because people and businesses are making less money and hence pay less income and corporate taxes. Whenever an economy is experiencing a downturn, Government spending tends to increase through fiscal and budgetary expansion.   

Subsidy is a sensitive economic tool used for helping certain targeted sector of the economy. Farm subsidies have existed for centuries in Western Economies. Farmers are subsidized so that their produce remains competitive in world markets while ensuring employment stays high. The effectiveness of subsidies can be viewed from different angles. On the negative side it leads to an inefficient allocation of resources. The positive side is providing protection to certain sectors of the economy to ensure constant supply of strategic resources like cheap food and energy and also ensures full employment.

In Malaysia, subsidies played an important role in our life by ensuring our cost of living stayed low. Subsidies will remain as long as the economy is doing well and it is also a political tool to win votes. Politicians knew the risk of getting unpopular when slashing subsidies and might get voted out in the next election. So it can be said that subsidy reduction is a policy tool of last resort and till this day it remains a foreign concept to most Governments. It will only be implemented when the state of the economy is in dire straits. Malaysia’s budget deficit problem is not an overnight phenomenon, it started after the last Asian Financial Crisis in 1998 as shown by the graph below.

Historical Data Chart

To prevent a fallout of the economy and maintain our economic growth, our Government implemented expansionary fiscal and monetary policies. To raise the necessary funds our Government have the options of raising taxes or borrowing. Again raising taxes will be an unpopular measure as during that time our economy is going into a recession. Again during recessions, individuals and corporations will be earning less and hence their taxes. There is only so much blood you can squeeze from a turnip. So, our Government turned to borrowing. The following chart shows our Government Debt/GDP chart since 1996 which corresponds very well with the Government Budget deficit chart above.


Historical Data Chart


As indicated above, our Government’s Debt/GDP was in the low 30s during the 1990s. However, it never looked back when our Government embarked on the borrow and spend policy. Once we get into the debt bandwagon it is very difficult to get out of it because of the ever increasing interest payments. The following charts show the amount of money we paid for our interest rate obligations for our debt per year.   

Year
US$
% of Revenue
2010
3.84
8.01
2011
4.04
8.96
2012
4.85
9.78


As can be seen above, our interest rate obligation on Government debts has been on the rise every year. In terms of value in 2012 we are paying about RM 16 billion (USD 4.85 billion x 3.3) in interest payments. What is more alarming is that for every RM100  of tax collected by our Government RM9.78 goes to the creditors. All our hard earned monies are being used to pay for the unnecessary wastages and imprudent spending by our Government. So now we know our Government is high and dry and heavily in debt. What will be the next course of action other than borrowing more? Cut spending but unfortunately not cutting it’s own but the masses. Thus the next policy option is to look for ways and means to trim spending and subsidy reduction cannot be a better option. As you know economic policies is a double edge sword or in other words there are side effects accompanying subsidy reduction.  


Side effects of Subsidy removal

Price Inflation

The amount of subsidy in 2012 was about RM 42.4 billion or 4% of GDP and is expected to drop to RM37.61 billion in 2013. The bulk of the subsidy went to fuel which accounted for about RM25 billion.  Needless to say the price of fuel will continue to go up as subsidy reduces in the coming years. Since demand for fuel is ‘inelastic to price increase’ the ‘trickle down’ effect will push up the prices of most goods. This is known as ‘cost push inflation’ as fuel is used in transportation and manufacturing. In layman terms this is called price inflation. The following chart shows the CPI (Consumer Price Index) which tracks the prices of certain essential goods paid by consumers.

Historical Data Chart

In May 2010, Minister Idris Jala called for the reduction of our subsidies or our country faced bankruptcy. Unfortunately, the effort only resulted in one thing – soaring prices of goods and services as indicated by the chart above.

Crowding Out Effect

One of the dire problems faced by the Malaysian Government is the Budget Deficit. Budget deficit is a term to describe a situation where expenditure exceeds revenue. When a Government overshoots its expenditure it needs to borrow or increase taxes in order to finance the economic activity. As we already stated increasing taxes is not a popular option and most Government will try to avoid. This leaves us with borrowing as the other option. Borrowing from either domestic or foreign only resulted in one thing – increasing debts.

Malaysia Government Debt to GDP

Given our current Government Debt to GDP stands at 54.8% as of 2013 which also capped at 55%, there is not much space to manoeuvre. Our Government needs to think of a way to raise funds without adding more to the official debt. How is it being done? One way is to source from domestic and that is by soaking up money from the public.

To illustrate, we use an example where the total GDP for country A is $100 million and the breakdown of the GDP is as follow. For simplicity, GDP can be defined as follows.

GDP = C + I + G + (X-M)  where,

C = Consumption
I = Investment
G = Government Spending
X = Export
I = Import

Consumption
50
Investment
20
Government
30
Total             RM
100


Government spending which is RM 30 million in this case can be further breakdown into education, defence, preservation of law and order, subsidy and etc. So by diverting resources from reduced subsidy to the private sector it can then be channelled the extra funds to other sectors such as defence and infrastructure.  So as you can see there is no change in the total Government expenditure which is $30 million. The only change is the composition of the spending and in this case a reduction in subsidy and an increase in defence and infrastructure expenditure. This is because the Government did not create any new money into the economy.  

So what we can deduce from here is that whenever the Government borrows or divert resources from other sources where the source of money is already in existence it will not add to existing money supply. This is what economists called non-monetized borrowing or non-monetized deficit financing. This is mainly paper shuffling or the transfer of money from the left to the right pocket and hence will not affect the Government Debt level. But this will eventually crowd out private spending and will not bode well for the economy. As government spending increases less will be available to the private sector and this will lead to reduced economic activity. How will this affect the economy?

You see our Government PRODUCES  ALMOST NOTHING that can add to its revenue. All of its revenues are derived from personal and corporate taxes, royalty, excise duty and so on. So when private expenditures are reduced, private investments will follow suite and this will lead to lower employment and also reduces our ability to earn foreign exchange.

Will Subsidy removal help reduce Deficits?

Obligation to Interest Payments

.
An opportunity costs exists when our government meets its interest payments. If it had not accumulated so much debts then more funds would be diverted to other sectors of the economy such as subsidized, free education or maybe elimination of road tolls.

Further too this there will always be a threat from increasing interest rates. Increase interest rates mean higher interest rate obligations. There is no guarantee that our interest rates will always remain low because there is always the external threat. For example the current monster Japanese Quantitative Easing means the Yen will be falling to new lows. Being an export nation and with the current dampening prices of global commodities it will be a challenge for us to maintain our level of exports. We will either have to increase our productivity (which I don’t think can happen) or artificially make our export prices cheaper by depreciating our Ringgit. Bank Negara has recently announced that it is holding rates unchanged for the near term. Again as it is known, Central Banks cannot promote both Monetary  and Exchange Rate Policy at the same time.

To promote depreciation of our Ringgit, interest rates will have to rise so as to compensate foreign investors for the loss in their foreign exchange. If our rates remain unchanged then there will be a big exodus of foreign funds from our country. When foreign funds depart in a big way then it will cause further spiralling downwards of our Ringgit because they will be selling ringgit for foreign currency.  

If Bank Negara chooses to promote internal stability by holding down interest rates then we will have to sacrifice our Ringgit. But then it poses a threat to the private sector in terms of higher debt load due to our Ringgit depreciation. Below are the charts of both internal and external public and private debts.

Debt
Domestic
Foreign
Total
Public
438
18
456
Private
749
239
988

Debt
Domestic
Foreign
Total
Public
51%
2%
53%
Private
87%
28%
115%


As from above, it can be seen that the real problem is in the private sector. The total private sector debts amounted to 115% of GDP and 28% of it is foreign based. So whichever policy Bank Negara chooses either by holding rates low or intervening in the foreign exchange market to prop up the Ringgit the private sector will still be affected. In short Bank Negara is in between a rock and a hard place.

The question is since deficit is bad for the economy why not our Government starts controlling it? The answer has to do with the special interest group or UMNO as we know it. When our Government spends and increase the deficit, the special interest group will be benefitting from new projects and kickbacks while the losers will be the poor due to the increased debt their future generations will have to pay. Alternatively when our Government decrease spending and reduce the deficit then obviously the losers will be the special interest group and the winner will be the public due to lower future debts their children will have to carry.

Thus any Government program that promotes spending that increases the deficit represents a form of Wealth Transfer or a reverse Robin Hood operation. Because it takes money from the average and poor Malaysians (in taxes) and pays the rich Malaysians and Foreign Bond holders in terms of yields.

Other Solutions available?

The answer is in fact YES. For any recovery to be sustainable, initially the government will have to lead the way by increasing taxes and reducing its own spending on the fiscal and monetary framework. Yes increased taxes in the private and cost cutting in the public sector. How can it be done?

Increase Taxes

Is there a situation where a tax is not a tax? When the tax is a ‘sin tax’ and this refers to tax imposed on consumption of ‘sinful goods and services’ like alcohol, tobacco and gambling. It is often argued that consumers of sinful goods and services are causing unnecessary health care and law and order maintaining expenses. And they are causing the rest of the 90% of the population who are not ‘sinners’ to pay for those unnecessary expenses. If there are less people consume alcohol and tobacco there will be less cancer and heart attack patients and hence less health care expenses to be allocated to these patients. Similarly if less people are frequenting the casinos or even the number forecasting outlets then it not only resulted in fewer family break-up but also a reduction of crime. Naturally the government will allocate fewer resources to fight crime and maintain law and order. If this problem is not arrested then we will always face the problem of increasing police to population ratio and hence expenses.

From a Canadian study where the price of a pack of cigarette was raised from 59 cents in 1977 to $1.94 in 1993, it was found that the consumption of tobacco felled 30% during that period. What other benefits following such a reduction in the consumption of tobacco? It is estimated that at least $160 to $180 billion could be saved from related expenses in healthcare and other social costs. Moreover it also found that from the increased in price only 26 cents end up in the Government’s coffer in terms of taxes while 96 cents went to tobacco companies and their sellers.

A study by Will manning at the Rand Corporation on alcohol found that drinkers are paying much less for their cost for their activity. Their report found that for every ounce of alcohol consumed the drinkers are paying 22 cents but it costs the society 48 cents. It also found that increase taxes will lead to lower consumption. A 10% increase in alcohol tax will lead to a 3% drop in consumption.   

Cost cutting in Government

Or should we say fat trimming in the public sector. Isn’t it fair that private sector austerity type measures like wage and bonus freeze, head count reduction and other cost cutting measures be applied to the public sector? I reckon it about time and put an end to the special interest group in lobbying for the benefit of the public servants. Why are they (public servants) getting all the benefits like yearly bonus and other perks since their salaries are finance by the taxes from the private sector? So what needs to be trimmed?

Cutting Public Employees

Malaysia has again achieved another record breaking effort but this time for the wrong reason being one of the highest public servants to population ration in the world, according to the OECD standards in 2009. All I can say is that this is a perfect for sending our Government to the cleaners. With more than 1.3 million civil servants serving a population of 26 million is indeed a feat that cannot be easily accomplished. The total salary paid to our public servants in 2008 totalled RM 41 billion. Our bloated PM’s Department has about 43,000 workers in 2011 while the White House has only 1888 workers. Budget allocated for the White House is only US391 million whereas our PM’s Department was allocated RM 18.2 billion. The following table best illustrate our achievement.

Country
(%)
Malaysia
4.68
Hong Kong
2.3
Taiwan
2.3
Thailand
2.06
Korea
1.86
Phillipines
1.81
Indonesia
1.79
Singapore
1.5
Laos
1.24
Cambodia
1.18


When public servants are trimmed there are ample room for improvement in terms of delivery and efficiency. Unproductive workers should be dropped while the productive ones should be rewarded. This also helps to reduce work redundancy in the public sector. Currently there is a trend going around the world to reduce the public servants to population ratio. But we tend to do thing the other way. In law instead of punishing the victims we punish the whistle blowers and in the public sector we attest to Gresham’s Law where the worst push out the best.


Privatizing the Public Sector

Another reform that can be done is to privatize certain Government linked Companies (GLC) in Malaysia. Privatization creates competition between the public and private sectors. This also helps to improve the competitive levels among the public and private enterprise workers. Needless to say privatization gives companies the chance to experiment with strategies and other risky adventures that are once reserved for the private companies. A fine example will be Telekom Malaysia. Before their privatization in the early 1980s, applying for a phone line in remote areas is virtually close to impossible. This is due to the uncompetitive nature of the business and Telekom Malaysia has virtually a monopoly on the business. So there is no incentive for the company to expand its business and thus improvement in delivery and customer relationship.

However since it was privatized in 1987 its services and delivery improved multiple folds and can now compete with both local and foreign private telecommunication operators.

Accountable Public Sector

A new method or an accounting system is needed to record all transactions that are free of fraudulent practices, valuations and budgeting. Rather than letting our current system which enables debts to be hidden as an off balance sheet item, we need a more robust system that is transparent, open and free from deceptive accounting which will lead to deceptive management practices. As for the precedent according to the Economist, New Zealand in 1992 became the first nation to adopt the commercial accounting principles with full balance sheet of its assets and liabilities.  


Controlling the Housing Bubble

Thanks to the Quantitative Easing effort by our Government. The easy availability of cheap credit has led to the biggest boom in our real estate sector. Real estate flipping has been one of the favourite past time among Malaysians for the past few years. As a result house prices in prime or tier-1 areas in Penang, Johor and Selangor have gone through the roof.  The asset price boom for the past few years has resulted in many low to middle income earners unable to afford a house. The average price of a double storey link house in the Klang Valley is about 8 times the annual household income in Malaysia. Based on the monthly household income of RM5000 this work out to about RM480,000 for a house.

But effort by our Government to mitigate the problem of housing shortages by building more affordable homes seems to be getting nowhere. Spending more on the housing sector will worsen the budget deficit. This is because the building of new homes always lag the number of people falling into the ‘unable to afford’ category due to the rapid rising costs of living. One way to solve the problem is to control the rapid rise in housing prices so that more people can afford it. How can we do it?

Traditionally, the commonly used policy to control an over-heating housing sector is by introducing cooling off measures such as increasing the interest rates. But increasing interest rates across the board will only help to take some steam off certain over-heated locations such as Penang, Kuala Lumpur, Johor Bahru and so on. How about other areas such as Kuala Kangsar, Taiping, Kota Bahru, Muar and so on? These areas have not experienced the steep housing price inflation as those indicated above. Thus when we increased the interest rates, then those who are living in smaller cities and towns will be affected because their income are lower than their counterparts that are living in K.L or J.B. The increased in costs of borrowing will reduced their demand for houses and thus will affect the local economy. This further exacerbates the rural-urban housing problem. One way to solve the problem is to implement ‘interest rate targeting’.  

By interest rate targeting we mean to implement different interest rates in different locations. This policy has proven to be quite effective in arresting the problem of excessive housing bubble in South Korea. So instead of setting interest rate across the board we set higher interest rates for over-heated areas like K.L or Penang while leaving the rest of the country with lower or unchanged interest rates. Thus, this not only helped reduce housing speculation in major cities but also aid housing boom in smaller towns.   

Capping Government Spending

If our Government seriously want to get out of its deficit hole, it first needs to stop digging. Since we already have a cap on Government Debt/GDP ratio in the Constitution, why not we extend it to Government spending as well? Since budget deficit is a by-product of over spending then why not we target the core of the problem? The main idea of having a spending growth cap is to ensure our Government will always spend within its means. There are several methods where we can structure the cap by way of population growth, inflation rate or GDP growth. Thus if we were to cap it to the GDP annual growth rate then the total spending by our Government’s for this year can only grow by 4.7% which is 2013’s GDP growth.
In Wrapping Up

It is always a dream for policy makers to achieve a balance budget. The problem is that while everyone wants a balance budget nobody wants to go through the process of doing what it takes to balance the budget. Nobody likes austerity measures like reducing consumption, increasing savings and wages and bonus freeze.
 
We are living in an age where instant gratification is the order of the day while delayed gratification has long forgotten. Similarly, in order to balance our budget deficit, our Government will need to impose austerity measures not only on its citizen but also on itself. Implementing ‘shock therapy’ economic policies is not new in Malaysia.

In fact the engineering of the last major blackout in 1993, has led to the mushrooming of the Independent Power Producers. Needless to say, since then we have been paying very high electricity bills. Another good example on how ‘shock and awe’ tactic being by our elites was during the Asian Financial Crisis. To make sure that the banking sector fell into fewer hands, more than 50 banks are forced to merge into 10 universal banks. Needless to say the winners are mostly the political allies and cronies.  Further to that, Idris Jala also used the same tactic by threatening the masses that Malaysia is going bankrupt by 2019. When the news was out and people are still in a state of shock and unable to provide any resistance, our Government has already steam rolled subsidy rationalisation. As a result our cost of living has since been rising rapidly.  

Shock therapy economic policy was introduced by a University of Chicago economics professor by the name of Milton Friedman. In his ‘shock doctrine’ he said that only a crisis produces real change. When a crisis occurs, action must be taken fast (3-6 months) so as to achieve rapid fire major changes or economic transformations such as privatization, tax increase, deregulation and cuts in social spending and subsidies. These are also the hallmark of the International Aid Organisations such as the IMF and World Bank because many of the top people running these organisations are from the Chicago School. Countries that obtained bailout loans from them will have to be subjected to shock therapy economic policies. These radical policies are also known as the ‘Chicago School Revolution’.

Another country that applied shock therapy tactics to succumb its citizen is Indonesia. Instead of following the Chicago School Revolution, Suharto leaned to the University of California at Berkeley which also known as the ‘Berkeley Mafia’. The Berkeley Mafia was funded by the Ford Foundation and is responsible for drafting of Indonesia’s economic blueprint. Similar to the Chicago Boys, the Berkeley Mafia with the help of The Ford Foundation set up the economics department at the University of Indonesia. Soon, these young economic graduates packed the Suharto’s Cabinet. Suharto started to implement shock therapy policies during the 1998 Asian Financial Crisis. He used the shock and awe tactics like repression and instilling fear on the masses pre-emptively so that the country would go into a shock. While the masses are still in a state of shock they are unable to provide any resistance. Suharto then proceeded to implement economic policies by allowing foreign companies to 100% of their resources and at the same time also granted tax holidays.  

Subsidy removal by our Government is a subtle form of economic shock therapy. It is as potent and deadly as Milton Friedman’s shock and awe therapy although it may be slower. Our current fuel subsidy removal is an example. By incrementing fuel prices by 20 cents each time our Government hoped that it incur less pain into the masses so there will less discontent and hence demonstrations. But they are wrong because the effects are the same – price inflation and less spending – which ultimately leads to less revenue for the Government in terms of taxes.   


The author is the Economic Advisor to the National Union of Bank Employees.