Fibonacci numbers is actually derived from a study on how fast a pair of rabbit breeds. The study is done by one of Europe’s greatest mathematician during the middle ages by the name of Leonardo Pisano, circa 1175AD. He is one of the first people to introduce Hindu-Arabic number system to Europe.
Origin of Fibonacci numbers
The study on the proliferation of rabbits is based on the assumption that the pair of rabbit never dies and always produces a new pair by end of the month. The question that we seek is how many pair of rabbits will there be in a year? On the first month there will be a new pair, the second month there two pairs and on the third month there will be three pairs and so on.
Hence the Fibonacci Summation is born. It is a series of numbers and to get the following number all you need to do is to add the current and previous number. It can be shown in the following.
1,1,2,3,5,8,13,21,34,55,89,144,233,377,610, ad infinitum.
Convergence to 0.618
However the numbers in this summation is somehow related to each other. What happen if you take the first number and divide with the second and the second with the third and the third with the fourth and so forth. You will find that as you go along the summation series the division will converge to 0.618 which is also known as the ‘Golden Ratio’.
| Number | Division | Result |
1
| N/A | |
1
| 1div1 |
1
|
2
| 1div2 |
0.5
|
3
| 2div3 |
0.666
|
5
| 3div5 |
0.6
|
8
| 5div8 |
0.625
|
13
| 8div13 |
0.615
|
21
| 13div21 |
0.619
|
34
| 21div34 |
0.617
|
55
| 34div55 |
0.61818
|
89
| 55div89 |
0.61796
|
More Mind Boggling Discovery
Even if you start with a different number in the series , the ratio will still converge back to 0.618. This was discovered by William F. Eng and known as the Eng Summation.
a) In this case the first number is bigger than the second
6,4,10,14,24,38,62,100,162,262, ad infinitum
when you divide 162/262 you get 0.6183
b) In this case the first two numbers are one positive and one negative
-12,7,-5,2,-3,-1,-4,-5,-9,-14,-23,-37,-60,-97,-157, ad infinitum
when you divide -60/-97 you get -0.6185
c) In this case the first number is a positive but the second is a negative.
28,-12,16,4,20,24,44,68,112,180,292,472,764,1236, ad infinitum
when you divide 764/1236 you get 0.6181
What the above display is that whatever numbers not only in what order, eventually it will converge back to the golden ratio of 0.618.
This shows the importance of using the ratio to display the interdependence of any number in the series even though there are not in line with the original Fibonacci Series.
Again if you divide the numbers the other way round and that means second divide by first and third divide by second and so on. Again you will find that the series will converge to 1.618.
Daily Life displaying Golden Ratio
This ratio is important because it occurs in many natural things such as seashell, galaxies, sunflower and so on. The distance at any point in seashell spiral to the center of the shell can always be related to the golden ratio. Even most flower petals are related to fibonacci numbers. Lilies and iris have 3 petals, buttercups have 5 petals, delphiniums have 8 petals, marigolds have 13 petals, asters have 21 petals and daisies have 34, 55 and 89 petals.
It even exists in our human body. If you measure the height of your belly button and divide it by your total height, the answer approximates 0.618.
So now the question is, how does Fibonacci summation help us in forecasting Financial Markets.
As far as we know if you divide the previous number (which is smaller) with the current number in the series, the ratio tends to converge to 0.618
Similarly, if you divide the next number (which is bigger) with the current number in the series, the ratio tends to converge to 1.618.
Fibonacci numbers in Stock Markets
The important numbers are 23.6%, 38.2%, 50%, 61.8%, 78.4% and 100% or percentages of retracement or advancement. The figure 23.6% can be found by dividing a number with another number which is located three place to the right of the summation (13/55 = 0.236). The 38.2% can be found by dividing a number with another number which is located two places to the right (34/89 = 0.382) and so on.
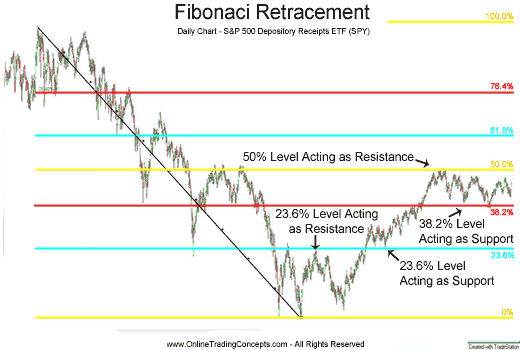
To forecast the level of retracement during a decline or advance we need to find the lowest and highest point in a chart and draw a trend line connecting them. Hence the fibonacci retracement can be obtained from there. The following chart shows a fibonacci retracement in percentages after a bull run.

Similarly the following chart shows a fibonacci rebound in percentages after a bear run.
Fibonacci Time Zones
However we can extend the Fibonacci Summation series to study time zones that can provide potential movement in prices. The summation can be applied as 1 bar, 2 bars, 3 bars, 5 bars, 8 bars, 13 bars, 21 bars, 34 bars and so on. A Fibonacci time series chart can be shown below.

As you can see from the above chart, different time zones are displayed that may indicate a change in the market price. However as a word of precaution, I never depend exclusively on Fibonacci in my market trading. I use it in conjunction with other indicators to get a second opinion because sometimes these indicators don’t work all the time in different market conditions like sideways or unactive markets.
I use Fibonacci to identify retracement levels in advance and decline markets and also to find price clusters or base building activities which are very good setups for profitable trading.
Moreover, with the discovery of the Eng Summation, it denotes another important finding and that is we don’t need numbers to be in exact to the numbers in the Fibonacci Series in order to have a precise prediction. Any numbers will do !!
Another significant implication is that when any two unrelated numbers are related due to the golden ratio will mean that there will be many opportunities to trade in between 2 and 3 or 2 and five or 3 and eight days time period. This is because there will be many set of Fibonacci summation numbers that will converge to 0.618. That means we can look at a different context of Time Zones. Instead of trading using the monthly or weekly charts, we can downsize it to days, hours and minutes and even up to the seconds and nano seconds charts as used by institutional investors in their High Frequency Trading Algorithms.
That means there also exist Fibonacci retracement charts for advancing and declining markets in milliseconds charts. This will open up a whole new possibility to trade and also means that you will always stays ahead of the crowd. That is why High Frequency Traders will always ahead of us because they trade with softwares that can mechanize their trading methods and algorithms to buy and sell at predefined support and resistance levels.
This explains why HFT traders almost always wins in the market because of the speed of both the hardware and software that they use.Trading software from Nanex Corporation are able to process 1.7 million instructions a second even though the hardware runs on a Pentium 4 processor.
No comments:
Post a Comment