Cycle frequencies can both be short and long, it can last from minutes until thousands of years. Understanding long term cycles in stock market helps you determine the overall market trend and similarly short term cycles helps you determine your timing in the entry and exit points in the stock market. The following chart shows some short and long term cycles.

Perhaps one of the most extensive studies on cycles is done by Dr Raymond H. Wheeler, Chairman of the Department of Psychology, University of Kansas. He commissioned 200 researchers to work for 20 years to study the effect of weather on mankind and also cultural activities dated back to the dawn of civilization. Over 3000 years of weather pattern was studied and so was 20,000 pieces of art and literature. After the extensive study he concluded that there exists a 100 year climate cycle and phases that influence human behaviours. The different phases can be described as the following:
- Cold-Dry
- Warm-Wet
- Warm-Dry
- Cold-Wet
510 years World Dominance Cycle
According to his calculations we are now in the Warm-Wet phase and should last until 2100. Further to this he also discovered the 510 years world dominance cycle. His record dates back 3000 years ago during the Greek and Roman eras. The following are dates and events that took place since then.
- 570 BC - The Romans came to power after the Greeks collapsed
- 60 BC - The Romans weakened and gave rise to the emergence of Asian Powers
- 450 AD - Asian Powers declined and gave rise to Charlemagne and Britain power
- 960 AD - Global power shifted back to Asia with the rise of Genghis and Kublai Khan.
- 1470 AD - Europeans at the forefront of global dominance. Spain and Portugal were at their height of power when their naval fleet reaches the four corners of the Earth. Later we also see the re-emergence of Britain and also other European powers like The Netherlands and Germany. The United States came into the scene at a much later stage when the Global Power is about to be shifted back to Asia.
- 1980 AD - As can be seen since 1980 the shift in the Global Power from West to East began once again. Since the 1980s we can see the re-emergence of Asian powers like China, Russia and India. So once again the balance of power will stay in the East for the next 510 years which will go right into the year 2490.
The above are extracts from Dr Raymond’s book called ‘The Big Book’ which contains most of his cycle studies. In it you will find that the 510 year ‘civilization cycle’ can further be broken down to three 170 year cycles which itself contained three 50-56 years cycles and so on. In other words there are cycles within a cycle. The most famous economic cycle is the Kondratieff Cycle (50-54 years). Kondratieff, a Russian economist whose cycle study is based on wholesale prices, interest rates, wage levels and production indexes from the period 1780 to 1920. In his paper titled ‘The Long Waves in Economic life’ he showed that there is an existence of a 48-60 years cycle in the overall economic activity in the Western world. The following chart shows the Kondratieff wave in action in the U.S Stock market.

Where are we now?
Historians have found that 50 years business cycle has already been in existence since the biblical days. In the Old Testament it did mentioned about farmland being lie fallow in the seventh year of cultivation. After a total of seven groups of these seven years (7x7 = 49 years) the land was to lie fallow two years in a row. The main question is where are we now in the Kondratieff cycle? From his study on economic cycles he found that the most valid recent peaks are occurring in 1814, 1865, 1929 and 1974s and the next peak will be around 2020s. The 50 years Kondratieff cycle can be classified by the following phases which are divided into five equal decades.
- First Decade – Recovery (1974-1984)
- Second Decade – Boom (1984 – 1994)
- Third Decade – Peak and Transition (1994 – 2004)
- Fourth Decade – Collapse (2004 – 2014)
- Fifth Decade – Trough and transition (2014 – 2024)
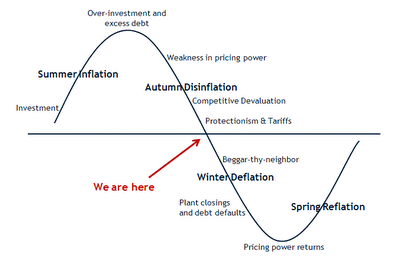
We reckoned that we are now in the fourth decade of the main cycle because currently global economies are engaging in competitive currency devaluations and also at the same time enacting protectionism policies. The following graph shows a more detailed succession of events leading to the current situation and also what to expect from now on.
Does a Stock Market Cycle exist?
Edward R Dewey can be considered the modern day authority in cycle studies. In his book ‘Cycles’ he documented his studies on cycles with data dating back to the 1830s. His book is considered the bible of cycle studies as to Benjamin Graham’s Security Analysis to Fundamental Analysis. What he found that the 9.2 or 9.225 years cycle to be exact is the most accurate of all. He estimated that there is only 1 in 5000 chance that the occurrences can be coincidental.
Then we have Veryl L. Dunbar in his 1947 article ‘The Bull Market’ printed in Barron’s June 1952 issue discovered the 46 month cycle. His analysis on cycles for the past 123 years yielded a 97% accuracy rate or predicted 62 out of the 64 cycle occurrences. John Hurst, another pioneer in cycle studies identified 12 dominant cycles existing in the stock market. Below we present to you a table of compilations of various cycles and different timeframes of the stock market that has existed and still valid till today although there might be some slight changes in the timeframes.
How cycles can assist you?
As a Stock Market investor would it be nice to add a tool to your arsenal that may help you to determine the general trend of the market and also to buy or sell before the market reverses. As you know Stock Market prices move in trends either up, down or sideways. For long term investors (defined as holding stocks more than 1 year), a solid knowledge of long term market trend or cycles is sufficient. This is also known as the Primary Trend in the Dow Theory.
| Years | Months | Weeks | Days |
18
| |||
9
| |||
4.5
| |||
3
| |||
1.5
|
18
| ||
1
|
12
| ||
0.75
|
9
| ||
0.5
|
6
|
26
|
182
|
0.25
|
3
|
13
|
91
|
1.5
|
6.5
|
45.5
| |
0.75
|
3.25
|
22.75
| |
0.375
|
1.625
|
11.35
| |
0.1875
|
0.8125
|
5.687
| |
0.0937
|
0.4062
|
2.843
|
How cycles can assist you?
As a Stock Market investor would it be nice to add a tool to your arsenal that may help you to determine the general trend of the market and also to buy or sell before the market reverses. As you know Stock Market prices move in trends either up, down or sideways. For long term investors (defined as holding stocks more than 1 year), a solid knowledge of long term market trend or cycles is sufficient. This is also known as the Primary Trend in the Dow Theory.
For medium term investors who are holding their portfolio between three weeks to a year, it will be advantageous to have some knowledge of the Secondary Trend or cycle. Secondary Trend refers to stock market trends that last between 3 weeks to a year. Lastly for short term investors who are likely to hold stocks for not more than 3 weeks again it will be advantageous to have some knowledge of the Minor Trend or cycle in the stock market. The following chart represents a cycle in the form of a sine wave. It also shows the different stages of market activity in one market cycle. During the trough stocks are accumulated and will be mark-up on the way up. At the peak stocks will be distributed and when done then it’s time to mark-down their prices and the cycle will begin anew again.

We will demonstrate to you using a live sample with the FBMKLCI. The following chart of the FBMKLCI clearly exhibits the existence of cycles. There are two cycles in existence and the first is between October 2012 and December 2012 while the second starts from the beginning of December 2012 to Mid February 2013.

If you have bought during the first low during the end of November 2012 and also the second low in mid February 2013, we are confident that your investments will performed much better than other times during those periods. So we hope that by now you should realised that with a clear understanding on market cycles and trends it will certainly help you make better informed decisions in your stock market investments.
No comments:
Post a Comment