Tuesday, June 25, 2013

Is this the long awaited Emerging Market Crash?


We reckoned that the long overdue ‘deleveraging’ of the financial markets has finally arrived. The risk of Emerging markets imploding seems to have heightened for the past month. Reasons being the following.

Japanese reflationary policy already runs its course

The Japanese Government under Shinzo Abe tried to rescue its economy from the  deflationary grip by employing the same strategy used during the 1930s,  to reflate the economy. By reflating we mean the government trying to achieve an inflation rate higher than the normal long  term rate so as to restore price level to pre deflationary level and in this case before 1998. As a result the Japanese government announced its objective of achieving an inflation target of 2% at any cost. The Bank of Japan is committed to buy into the Bonds and Equities market. Following the Bank of Japan’s intervention in the bond market the Yen fell to a seven month low.

As a result the Nikkei 225 had a tremendous run up from the low of 8,600 point  in October 2012 to 15,942 point in May 2013. This represents a 90% rise. The following chart shows the Nikkei 225 performance for the past year.


However as of late the Japanese economy has not been performing as anticipated and seems to be running out of steam. The is mainly due to the fact that the economy is no longer responding to further monetary easing. To put it another way, the effects has already worn out and failed to extract Japan out of it’s ‘liquidity trap’. Moreover, Japan is still running trade deficits for the past few years and huge Government Debts to GDP as shown below despite trillions of ¥ been pumped in.


What Japanese investors experiencing soon will be the remnants of monetary easing which is higher volatility in their financial markets. This is also a sign that the Japanese authorities has lost control over their economy. They are in a state of denial and in time we will see the USD/JPY moving above 150 , inflation, more bailing ins and bailing outs, fallout of the Nikkei and so on as a result of its recent policy. In short many Japanese investors is going to lose a lot of money when the dust settles.

China officially in Bear Market

China’s Shanghai Stock Exchange dropped most since August 2009. Today it dived 5.3% or 109 points to close below the psycological 2000 points since December last year. The Shanghai Stock Exchange has dropped more than 20% from February this year (2444 points) to 1963 points today. A drop of 20% or more confirms the Shanghai Stock Exchange in bear market territory. This can be shown by the following chart.


The following are the reasons for the sharp fall.

  1. The downgrade of China’s economic growth prospect from 7.8% to 7.4% in 2013 and 8.4% to 7.7% in 2014 over the weekend by Goldman Sachs.

  1. Recent announcement by PBOC (People’s Bank of China) that no more monetary easing in the near term. By running a tight monetary policy it hoped to tackle structural problems such as misallocation of funds in the near term. Evidence of credit squeeze can be seen from some major banks in China offering free gifts to attract term deposit customers.

  1. Cancel of Bond sales. Due to PBOC’s tight money policy, attempts by a few Chinese companies to sell bonds to raise money has been cancelled. It include Chinese Development Bank and China Three Gorges Corporation.

  1. Moody’s revision of Hong Kong’s Banking system outlook to negative due to its exposure to China.


  1. This morning Bank of China announced that silver transfer service, online banking, moratorium on transfers fully suspended. A sign of bank run to come?

As a result most stock markets emerging Asia dropped sharply.

Hang Seng - 2.2%
All Ordinaries - 1.54%
Jakarta - 1.9%
KLSE - 1.01%
Nikkei - 1.26%
Straits Times - 1.6%
Kospi - 1.31%

As we have said repeatedly we are entering a new era where Volatility is the name of the game. With China’s implosion its effect for the rest of Asia is yet to be seen as China remains the top trading partner of most Asian countries. We reckoned that pain will be felt around Asia soon as China starts deleveraging.

How about our KLSE?

Again as we have warned repeatedly we are still in a state of denial. We are led to believe that our stock market is the strongest and our economy the most resilient. Our so-called Plunge Protection Team managed to shield us from the carnage that has been ripping through other markets. In our earlier article dated 13th of June on “Malaysia’s Economy and Stock Market Disconnect”, we have already detailed in length that fundamentally our KLSE will not hold and will have to correct soon.

We reckoned that the time has come for us to face reality. In the weeks ahead we will be expecting high volatility in the KLSE as loses mounts. In time we shall be able to see daily swings of 20-30 points instead of 10-20 points now. From the chart below it is obvious that our correction has just started and with the first support at 1743 point has just been taken out, we will soon be heading towards the 1700 point level where our next support lies.

Sunday, June 23, 2013

How to build a Portfolio and eliminate Trading Emotions with PEG for Dummies


For Dummies including me where time is a luxury, finding a way to construct a Portfolio that does not need much time to maintain is God sent. Why we need to spend hours a day to eyeball our stock prices and thus get emotionally involved? Studies have shown that most investors lost money in the stock market due to their emotions than anything else. When you start screen staring then you are in trouble. Is there a method where we can build a Portfolio minus all those complex financial modelling tools used by Wall Street experts?


Fortunately, there is a simple method to select stocks that will minus all the complex fundamental and technical analysis. It is ideal for folks like me who are about to retire and needed to build a retirement nest egg. The method is called PEG or P/E to Growth which was developed by Mario Farina and popularize by Peter Lynch. The formula for the PEG is as below.


How to calculate PEG?


PEG = (P/E ratio) / Annual EPS Growth


Say ABC widget is selling at $20 and it earns $1 per share this year. Its earnings have been growing at 40% a year. Then the PE ratio for the stock is 20 ($20/$1). Thus to calculate the PEG all we have to do is to divide the PE ratio by 40 or $20/ 40 or 0.5.

What happen if Price goes up to $80?
If the price of ABC Widget rises to $80 then we will have to recalculate the PEG ratio. Again the new PE ratio is $80/$1 = 80 and the PEG ratio is 80/40 which is equal to 2. Always remember that the annual EPS growth must be denominated by percentage not as decimal as in 0.4.

Rule of Thumb to determine whether stock is expensive

Basically, the higher the PEG the more over valued the stock. When the PEG ratio is <= 1 then the stock is considered reasonably valued to its growth rate. A stock is considered expensive when it’s PEG ratio approaches 2 and will likely be the next candidate for sale. If you are evaluating a few stocks from the same industry say palm oil PEG is a good tool for you to evaluate which stock is the most expensive. Another advantage is that PEG is available in many financial information sources and thus eliminate your time to calculate.

The bottom line is that we try not to pay more than twice the company growth rate as measured by the PEG ratio. Anyway this rule is not cast in stone and to determine whether you should only sell when the PEG ratio approaches 2 is a personal preference. Some people have a lower risk tolerance and hence will sell when it approaches 1.5. Hence with such a simple tool it not only helps you to get rid of your trading emotions but also help frees up your unproductive time spent on the stock market. You only need to re-calibrate your portfolio maybe once or twice a month - selling expensive and buying cheap ones.

# A word of caution though. This is an entry-level Portfolio building and requires time for fruition. More sophisticated Portfolio building requires the current approach to move up a few level. Studies shows that the performance of this current Portfolio approach is in the indicative range of 10-12% return per annum. To raise the performance of your Portfoliio beyond the 20% threshold you will have to incorporate additional tools other than PEG. This is beyond the scope of this article and will require a few more articles to detail the strategies.

Happy Trading !!!

Monday, June 17, 2013

Is Our GDP Growth a Hoax? What are they Hiding from us


There is always an assurance from our Government that the economy is doing fine, jobs are recovering, wages are going up and prices are under control. We are never been told what actually happened behind the scene or problems our economy is facing. Through propaganda by the media we are persuaded that everything is in the safe hands of the Government.

Even when economies around us are collapsing we are led to believe that our economy is the strongest, our share market is the best performing, our economic fundamentals are the best or in short we are the best managed economy. We are given the impression that our economy is ‘invincible and different from others’. But the problem is whether our economy is living up to what was preached by our Government. Is there a way to gauge the real performance of our economy other than relying on figures published by them?

To find out we need to know what make up the GDP and how much it has produced, traded, invested and consumed. The accumulation of all these numbers can be found in an economic indicator known as GDP or Gross Domestic Product. GDP can be defined simply as the total monetary value of all domestically produced goods and services in a given year.
The following is the chart of our country’s GDP growth from 2007 till 2013.


It can be seen that the GDP Growth rate in the latest quarter declined to 4.1% from 6.5% in the previous quarter. But by looking at the GDP figure in total doesn’t tell us anything. Other than 2009 during the Global Financial Crisis our country has recorded continuous positive GDP growth figures. Does this means that our economy is on the right track and our economic growth will go on perpetually? To find what causes the drop in the GDP Growth rate we need to look into the different components of the GDP.

Mathematically, the GDP can be defined with the following equation.

GDP = C + I + G + (X – M) where,

C = Private Consumption
I = Private Business Investment
G = Public or Government Expenditure
X = Exports
M = Imports

The GDP is made up of 5 components and hence our 1st Quarter GDP growth of 4.1% is a result of the combination of the above. To determine what causes our GDP growth to decline we need to look into each component separately. Below we present to you the five different components that make up the GDP.

Consumer Spending or C

The first component is the consumer spending which can be defined as the total amount of money consumer spends on everyday goods and services. Being an economic indicator it helps provide a gauge on the financial health of consumers. Increased consumer spending indicates not only higher disposable income but also better expectation and confidence in the economy. The following chart displays the pattern of the Malaysian Consumer spending since 2007.


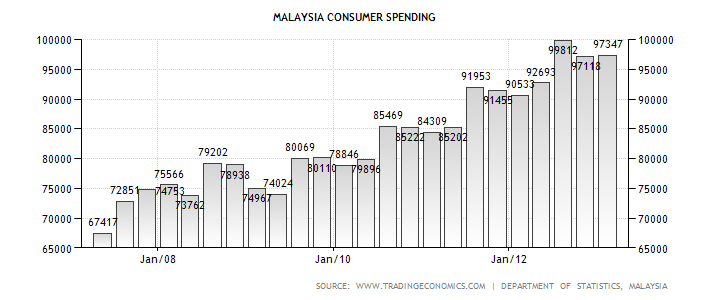
The consumer spending pattern seems to be on the rise since 2007. From the 2nd quarter of 2007 total consumer spending was indicated as RM 67.4 billion which then increased to RM 97.3 billion in the 1st quarter of 2013. This represents an increase of nearly 50% since 2007. Hence increased spending by consumers helped driving up the GDP value.

Private Business Investment or I

Private business investment is the second component of the GDP. From 2011 to 2012, Malaysia’s private business investments grew from RM 111.8 billion to RM 139.5 billion. This represents a 24.8% increase. The services sector commands the lion’s share with 72.4% of the total investments followed by the manufacturing sector at 25.3% while the remaining 2.3% went to the primary sector. In 2010 total private investment totaled RM 101.2 billion. The following chart displays the total private investments (domestic + foreign) as of 2009 to 2012.


Growth has been impressive since 2010 and last year grew the most. As of any indication of better times to come, Datuk Mustapha Mohd the Minister of International Trade states that in 2012 total approved investments was RM 162.4 billion. This was the highest amount as compared to RM 154.6 billion in 2011 and RM 105.6 billion in 2010.


Government Spending or G

The third component of the GDP is Government Spending. Government spending records the total spending of Federal, State and Municipal on goods and services. It covers the areas of education, defense, judiciary and other things that are related to the operation of the Government machinery. Government spending normally relates to the health of the economy. An increase in Government spending can be viewed as a positive sign for the economy because this is considered as expansionary policy.


From the above it can be seen that our Government embarked on an expansionary policy since 2005. Spending was relatively rising gradually until it went overdrive in year 2010 which we suspect coincides with the  Government’s ETP (Economic Transformation Program).


Exports or X
Malaysia’s Exports seems to constrict for the month of April. It recorded a total of RM 55.8 billion in April as compared to RM 60 billion in March. On a Month to Month basis this represents a decline of almost 8%.  


Imports or M

Malaysia’s import has been steadily on the rise since 2003 only to be interrupted by the Global Financial Crisis in 2008. From about RM 23 billion for the month of June 2003 it went up to about RM 55 billion for the month of April 2013. The mean for this period is RM 40 billion.    


Our Finding

In summary we know that we have rising C, I and G and a declining X and is relatively unchanged M. On top of that we also have 14 quarters of non-stop GDP growth which gave an impression that this trend may last many more years. Even our politicians are very excited over the figures. The following are some quotes taken from a few politicians and reported by the local media.

“As a result of Malaysia's solid investment performance last year, the country exceeded the private investments target of RM127.9bil for 2012 by 9.1%,” International Trade and Industry Minister Datuk Seri Mustapa Mohamed said at the Investment Performance 2012 conference yesterday as reported by the Star, 28th February 2013

The government expects private investment in the Malaysian economy to expand from 22.2% in the first half of 2012 and likely grow 30% next year, says Minister in the Prime Minister's Department.
Tan Sri Nor Mohamed Yakcop said on Tuesday that sustaining higher growth in investment and consumption would be the main factors in consolidating the transition from externally driven to domestically driven growth. As reported in the Star, December 4, 2012

Seriously, I don’t know why they are so excited. Those are just collective numbers that are used to superficially describe the performance of the economy. To have a better idea on how the economy is doing you have to look deeper into the breakdown of the GDP figures.

Why need the breakdown?

Firstly, as you noticed out of the RM 139.5 billion in private investments 72.5 % went to the service sector and only 25.3% to the manufacturing sector. What it is telling us is that more investments are going into the services sector and less to the manufacturing sector. This also means that we are consuming more than we produce and hence structurally we are moving towards ‘a consumer economy’. The following chart by the World Bank on manufacturing as a percentage of GDP clearly shows the trend.

n

The importance of the manufacturing sector in our economy had been on the decline since 2002. This decline means that our economy is moving more towards the consumer side and less on the manufacturing side. This gain in the consumer sector is also mainly due to the current housing and consumer credit bubble which led to the boom in the construction, commercial banking and real estate sector. All of which are consumer related.

Secondly, moving from production to consumption means that there will be a rebalancing of wages. Since the manufacturing sector pays one of the highest salaries and when an economy moves toward services (healthcare, hospitality and retail for example) then obviously wages earned by workers will be lower. As a result it will have the effect of lowering the ratio of wages to Gross National Income.

In time their salary growth will not be able to catch up with inflation. And this will be one of the sources of consumer complaint on their salaries not being able to meet their daily expenses. More importantly Malaysia is going through a fundamental shift and that is moving from higher paying manufacturing jobs to lower paying services jobs.

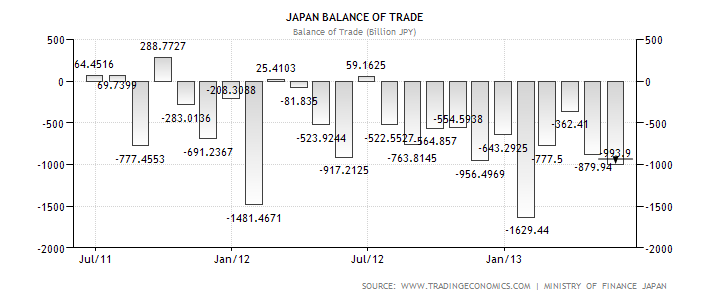
Thirdly, the manufacturing sector is one avenue where our country earns foreign exchange which also helps to pay its imports. A drop in manufacturing activity means a drop in exports and hence less foreign exchange will be earned. The following chart shows Malaysia’s Balance of Trade figures as from 2011. The Balance of Trade records Malaysia’s monetary value of exports over imports over a period of time. A trade surplus means exports exceeds imports while a deficit means exports lagged imports.


Malaysia recorded a trade surplus of only RM 943 million in April 2013. This represents the lowest trade surplus in 18 years since 1995. Deterioration in the trade balance means that we are now consuming more than before. This will become serious when our trade surplus becomes deficits because by then we will be spending more than we receive.

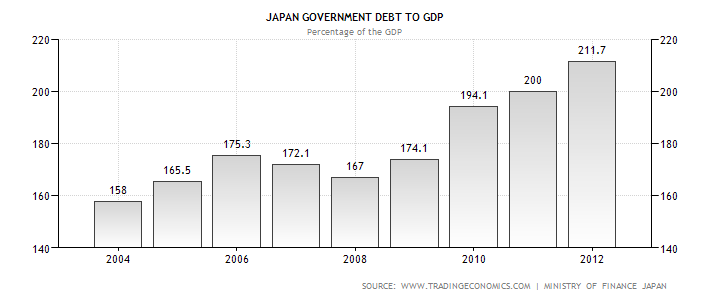
The sooner we address this problem the better because when our trade balance finally turned negative then it will have a negative effect on the Ringgit as well. On top of this our Government is also concurrently running a budget deficit as shown by the following chart.


When we have two economic problems at the same time (Budget Deficit + Balance of Trade Deficit) we have a situation known as the ‘Twin Deficits’.  Twin deficits are known to create havoc in an economy by accelerating the decline of a country’s currency and in this case Ringgit. This is because to finance our deficits we either have to increase taxes or borrow and if we borrow from overseas (normally denominated in US$) then the repayment of the principle and interest will be in foreign currency.

Lastly, to finance our consumption we can either borrow or finance it through savings or retained earnings. If our source of funds is derived from savings or retained earnings then it is not a problem because we are using resources from money earned from productivity. The problem is when we borrow to finance our private and public expenditure. As a result we are getting deeper and deeper into debt. The following is the chart for the total debts by the private and Government sector as of 2011.

Debt
Domestic
Foreign
Total
Public
438
18
456
Private
749
239
988


Given the GDP of RM 860 billion we can then proceed to calculate the Debt/GDP ratio of both the public and private sector. The table below summarizes the ratio of domestic and foreign debts held by the public and private sector.

Debt
Domestic
Foreign
Total
Public
51%
2%
53%
Private
87%
28%
115%


From the above we can conclude that at the present moment the private sector poses a greater risk to financial default than the public sector. The private sector is more exposed to any downside risk arising not only due to the size of the debt (87%) but also its exposure to foreign debt (28%). Large exposure to foreign debt is risk because it is subjected to movements in the foreign currency (US$ in this case).

The movement of the US dollar creates currency risk or what we called ‘Foreign Exchange Exposure’ in Treasury terms. Foreign Exchange Exposure refers to the risk associated to a decline in a country’s currency. Currency depreciation can have the effect of reducing a company’s profits due to increased cost in imports or loss due to the higher repayments of loans denominated in US dollar.

In Conclusion

From the above we can conclude that the reason for the GDP growth of 4.1% is the result of increased Consumer, Private Investment and Government spending. With declining exports, to maintain the GDP growth rate spending in Consumer, Private Investment or Government will have to increase. Since our GDP growth is fuelled by debt we will have to borrow more in the future. This is where the problem comes in.

Currently our public debt stands at 53% and almost near the debt ceiling (55%), any further borrowing will be capped. To facilitate further borrowing our Government will have to push the debt ceiling above the 55% threshold. How can this be done with the approval of Parliament?

A Black Swan Event?

One method is to create a ‘Black Swan’ event that is so mission critical that our Parliament will have no choice but to approve it. Similar approach can be seen during the implementation of the US$ 700 billion TARP program in the U.S during the Financial Crisis in 2008. Due to the artificially created sense of urgency, Congress is led to believe that by not approving the TARP program, the domino effect resulted from the meltdown of the U.S financial market will be disastrous. It will not only affect the financial markets in the U.S and Europe but the entire world. Hence Congress has no choice but to approve it even though the entire proposal is only a three page document.  


Thursday, June 13, 2013

Is FBMKLCI Crashing and can Najibnomics Prevent it?


It is finally happening and the FBMKLCI is giving way after more than a month of support by local pension and institutional funds. As we have mentioned earlier in our article (Malaysia's Economy and Stock Market Disconnect) dated on 2nd June where you need a strong economy to support a strong stock market. When fundamentals are lacking market manipulation will have to come to an end sooner or later. As a matter of fact the sooner the better so that the market will rid itself of excesses and begin another cycle of growth. In contrary it seems like every country in the world is busy trying to outdo each other in propping up their economies with cash injection or so-called Quantatitive Easing. But such a move is wrong because the longer they delay the eventuality (market correction) the worse will be the outcome.


Why Market Manipulation does not Work?


What they are doing is practically misallocating resources from the good to the bad sector of the economy by manipulating everything such as Libor, interest rates, Bonds, Stocks, precious metals, currency, Oil, HFTs, Options, Swaps, Forwards and any damn thing they can get their hands into. Propping up the stock market does not produce any ‘real economic benefit’ as in raising productivity or efficiency of the economy. Those are just ‘paper gains’ and does not contribute to the wellbeing of us in the long run. By propping up the stock market will also eventually leads to the formation of other bubbles like the real estate and consumer credit due to the artificially suppression of interest rate and the flood of cheap money into the economy. When the stock market crashes it also will bring down these sectors with it and the after effect will be disastrous.


Artificially propping up markets will eventually fail because there are only that many suckers that you can persuade to invest in the market. When everybody is ‘fully invested’ then that’s where the problem comes in because there is no further buying and eventually the Government have to step in to pick up the lag.


Najibnomics


As in Malaysia, Najib’s Government effort to support the stock market will have to come to an end because in order to support the market the government will have to buy in everyday in order to maintain the index. Eventually our Government through its agencies will end up being the majority shareholder of every single 30 index linked counters. They have to keep buying when investors sell if not the index will go down. If they don’t stop this insanity then in the end our ‘Government is the Market’ due to its controlling interest in the index linked counters. That is the problem facing all Governments around the world at the moment buying up all everything but unable to unload. As a result they ended up being the biggest owners of real estates, equities, financial derivatives and all the financial instruments that they manipulated. Finally all these investments will be to be ‘deleveraged’ and now this seems to be happening to financial markets around the world.


How other markets fared?


To see the extent of the deleveraging we present to you a few selected markets in Asia and Europe below.


FTSE  London


Hang Seng


Straits Times Singapore


Shanghai China


And KLSE Malaysia


Folks, our index hardly moved !!!


The New Normal


For the past one week the daily trading volatility of the FBMKLCI has increase quite substantially. What normally was a 3-5 points daily trading range turned into something much more volatile with trading range go up to 5-10 points. Now we are entering a stage where losses will mount and investors will start to get emotional. Once we passed this stage, investors will start to panic and will dump their stocks and that is when you will see increase volatility in KLSE. Daily fluctuations of 20-30 points in the FBMKLCI will be normal events. Further on such volatility will be the ‘new normal’ of the KLSE trading as what is happening in foreign markets now.


Welcome to reality!! If you have noticed for the past month since the elections on May 5th our market has somehow been shielded from the carnage in the Global Stock Markets correction. Our Plunge Protection Team (PPP) has been working overtime to ensure there is no panic in our market by limiting the market drop to single digits. Unfortunately we can say at that this moment is that it has come to an end and from now onwards we are very much on our own. They (PPP) are not going to support the market any more knowing too well that everybody is going to dump their stocks in the market.


The New Support


In summary we reckoned that the support level at 1712 points that we have indicated several times in our previous articles will not hold. With the current carnage in the stock markets around the world and our market’s decline still at its infancy, we have downgraded the support level to 1664 points. This is because the earlier low at 1743 have been breached as indicated by the following chart.


Happy Trading !